Read Log Files With Colors Using tailspin

Reading logs could be tiresome, specially if you are new to it. It all looks black and white and you have to look for the desired details in it. Not a pretty scene, right?
While I cannot change the logs for you, I can show you a way to make them look better and easier to read.
How you may ask. tailspin is my answer. It is a log file highlighter and it highlights details like dates, numbers, severity keywords (warning, info, error) etc.
And yes, it is written in Rust 🦀
In this tutorial, I will walk you through how you can install and use the tailspin utility to enrich your experience for reading logs and even text files.
"Let me color your logs" - Tailspin
Unlike other modern Linux commands that utilize a different syntax, you do not need to relearn the whole thing from scratch with tailspin.
It simply adds colors to your log/text files so can spot crucial elements immediately.
The best part is you don't require any additional configuration and it works out of the box.
Key features of Tailspin
- Colored output to read logs
- Search for keywords
- Monitor folders in real-time
- Ability to configure colors
- Uses less as a pager, so expect most features of the less command
Now, let's take a look at how to install the Tailspin utility.
How to install Tailspin in Linux
Tailspin is available in the default repository of Arch Linux and NixOS. But if it is not available for your distribution, I will also be sharing a way to install it through universal package managers.
For Arch Linux:
sudo pacman -S tailspinFor Nix:
nix-shell -p tailspinIf you are not using Arch or Nix package manager, then you can use the homebrew or cargo package manager.
As per my personal experience, I recommend using cargo Package Manager over Homebrew but it's totally up to you.
For cargo package manager:
cargo install tailspinFor Homebrew package manager:
brew install tailspinOnce you are done with the installation, let's take a look at how to use the Tailspin.
How to use the Tailspin utility
In this section, I will walk you through various examples of using the Tailspin utility. Let's start with the most prominent one.
1. Use Tailspin to get colored logs
To use the Tailspin utility to get a colored output of a text/log file, all you have to do is append the filename to the tspin command (tspin is a binary name for tailspin):
tspin <Filename>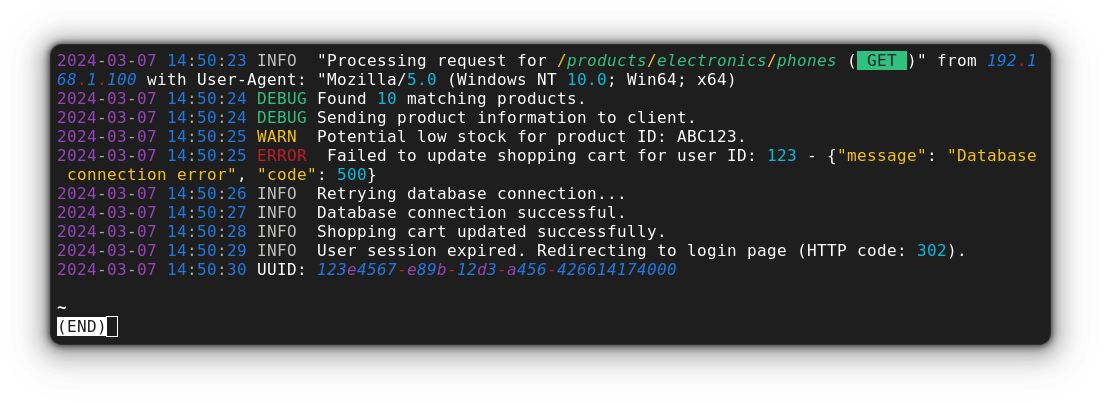
2. Monitor directory/files in real-time
The Tailspin utility lets you monitor directories/files in real-time to know what lines are being written to the files.
In my opinion, monitoring a specific file is more helpful than monitoring the entire directory and there's a reason why.
When you monitor a folder, it shows the changes are being made to the folder but it won't specify which file is being modified.
But still, I'll walk you through both ways: monitoring directories and files.
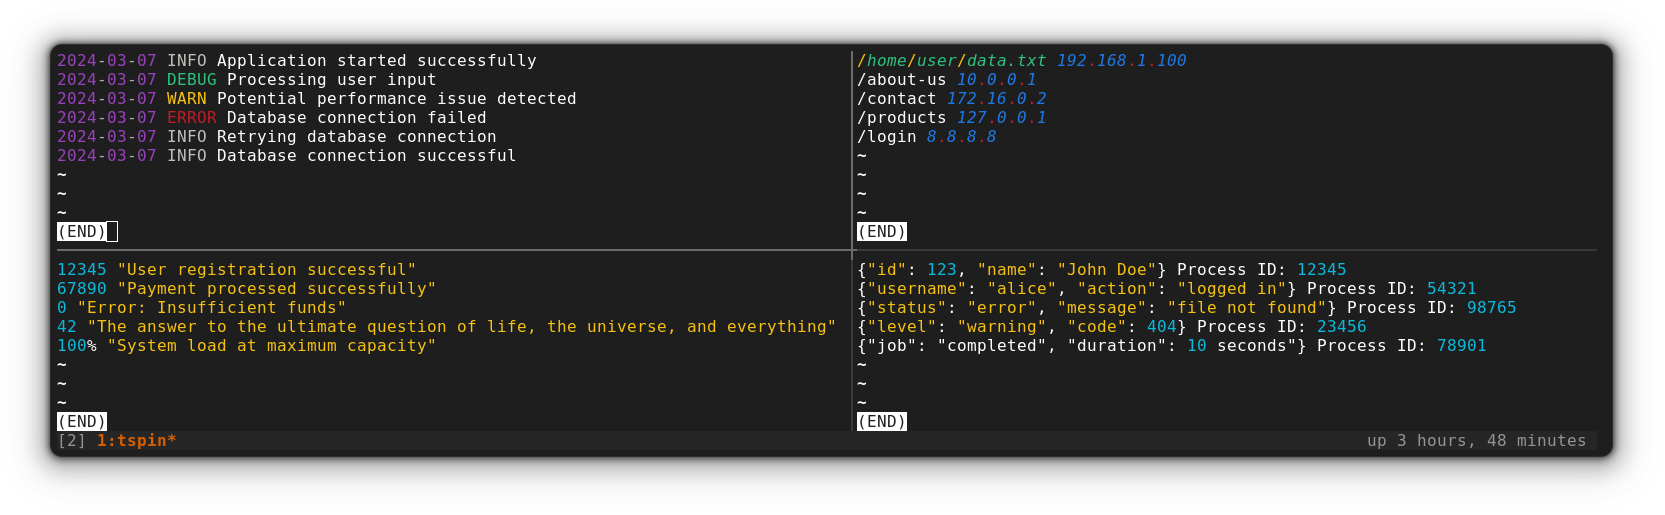
Monitoring directories
To monitor directories, append the name of the directory to the tspin command:
tspin <directory>
On the left side, I've used the tspin command over the logs directory, and on the right side, I edited the File1.txt file two times to let you know what you should expect while monitoring the directory.
As you can see, it didn't show the name of the file and that's why I prefer monitoring the file itself than the entire directory.
Monitoring a file
To monitor a file, append the filename to the tspin command and it will wait for the data to be written over the specified file. Once you write any changes, it will immediately show the lines written to that file:
tspin <Filename>
Déjà vu? Yes, it exactly looks the same when you use the less command to monitor a file as it uses the less command as a file pager.
3. Search for the keyword
To search for a keyword, open a file with the tspin command and then press the forward-slash (/) and type the keyword you were looking for.
For example, here, I searched for the term User and it will highlight the matched result:

4. Pipe it with other commands
Up until now, I've explained how you can use the tspin command over other files but it can be used on standard output as well.
All you have to do is pipe the tspin command to your actual command and it will highlight the output as it did with the log file:
<command> | tspinFor example, here I piped the tspin command to the journalctl command:
journalctl -f | tspin
5. Choose a specific color to highlight certain keywords
The Tailspin utility uses the predefined colors when used but it also allows you to specify which colors to apply on the specific elements.
For that purpose, you'd have to use the --print flag and specify the color with the --words-<color> flag as shown here:
tspin <Filename> --print --words-<color> <keyword>For example, here, I used the red color to highlight the term popcord and the yellow color for the term movie:
tspin test.log --print --words-red popcorn --words-yellow movie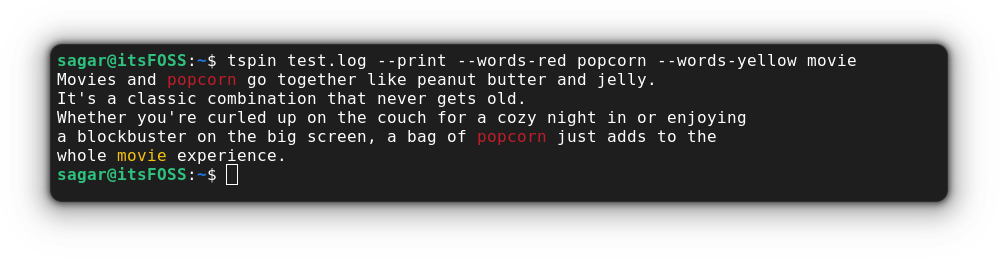
Wrapping Up...
I use the Tailspin utility to find a keyword by highlighting it with a bright color. Sure, writing such a long command is not a feasible option and that's why I created an alias for efficiency.
I hope you like this utility as much as I do. If you require any further assistance related to this utility, then feel free to leave us a comment.
Source: It's FOSS