How to Implement Centralized Logging With Amazon CloudWatch?
Monitoring the complex architectures of applications and resources manually can be a hectic task to do. This can shift the focus of the user from developing core business logic to tracking the resources for various purposes such as functional efficiency, cost optimization, effective usage of computing resources, etc.
To scale high-level of complex architecture, a user requires a central service where the activity of the resources is recorded and displayed on a single dashboard. In AWS, the main service used for this functionality is AWS CloudWatch.
Quick Outline
This article covers the following aspects:
- What is AWS CloudWatch?
- What is Centralized monitoring and Logging in AWS CloudWatch?
- What are the Problems Associated with Log Files?
- How Centralized Monitoring by CloudWatch Resolve These Problems?
- How to Implement Centralized Logging with Amazon CloudWatch?
- Bonus Tip: Benefits of Centralized Logging Feature
- Conclusion
What is AWS CloudWatch?
AWS CloudWatch is a management and monitoring service used for tracking the activity of various applications and resources running on the AWS infrastructure. With CloudWatch, users can monitor their application’s stack and take automated actions to minimize time consumption and functional complexity. Furthermore, this allows the users to free up idle resources for cost optimization and to focus on the business logic, value, and building applications.
CloudWatch is actively used for its metrics, alarms, and logs but it also offers other functionalities for the users to gain meaningful insight into their systems and applications. By actively monitoring the resources, users can identify and fix operational issues in their resources and applications. However, for tracking the resources and providing actionable insight to users, CloudWatch utilizes the Centralized Logging feature.
What is Centralized Logging in AWS CloudWatch?
The centralized monitoring and logging feature of AWS CloudWatch allows users to collect and analyze the resources’ activity from a single dashboard. This monitoring of the resource and application is stored in the Log files. Instead of inspecting multiple servers manually, accessing the record of events occurring in a resource from a unified location in the form of salient logs for debugging purposes is exceptionally easier and a smart choice.
In AWS, every application generates log files. These log files capture important information about the application and help the users to monitor and track the activity of the resource. For instance, there is an application whose instances are running across multiple servers. These instances will create log files separately. So manually monitoring these log files for identifying and fixing the issue can be a time-consuming and expensive approach.
Learn more: What are CloudWatch logs in AWS?
What are the Problems Associated with Log Files?
Consider a user who placed an order on an E-commerce website running on multiple servers. For load balancing, the request of the user has been forwarded to one of the servers. However, the customer has not received any confirmation email of the order from the server.
The IT team will inspect the log files in order to determine the faulty server. However, there are certain problems that are associated with the log files. If there are multiple EC2 instances running for an application, then a user cannot simply SSH into each instance and analyze the logs. Similarly, if autoscaling is enabled on the instances, then an EC2 instance will be automatically deleted in case of any server failure. This EC2 instance will be replaced by a new instance which results in the deletion of log files.
Read more: How to Set Up Amazon EC2 Auto Scaling for Your Applications?
How Centralized Monitoring by CloudWatch Resolve These Problems?
By implementing centralized logging and monitoring, the log files of EC2 instances are copied to one central location. This central location is “Amazon CloudWatch”. To achieve this functionality, the CloudWatch agent has to be installed on every EC2 instance.
This CloudWatch agent ensures that all the log files from individual EC2 instances are copied from individual EC2 instances to the CloudWatch service. This functionality is not limited to one-time activity. Instead, every time a new log file is created, the CloudWatch agent will copy this log file to the CloudWatch dashboard for the user. CloudWatch consists of a user-friendly interface to begin with. Users can use CloudWatch to monitor and trace the activity of several instances and can detect different patterns to determine the root cause of an instance’s failure.
How to Implement Centralized Logging with Amazon CloudWatch?
To implement Centralized Logging and Monitoring with Amazon CloudWatch, follow the below-mentioned steps:
- Step 1: Create an IAM Role
- Step 2: Create EC2 Instance
- Step 3: Install CloudWatch Agent
- Step 4: Verification
Step 1: Create an IAM role
In this section of the article, we will create an IAM role which will be attached to the EC2 instance later. This IAM role will contain the required permissions for the CloudWatch service to access the log files using the CloudWatch agent.
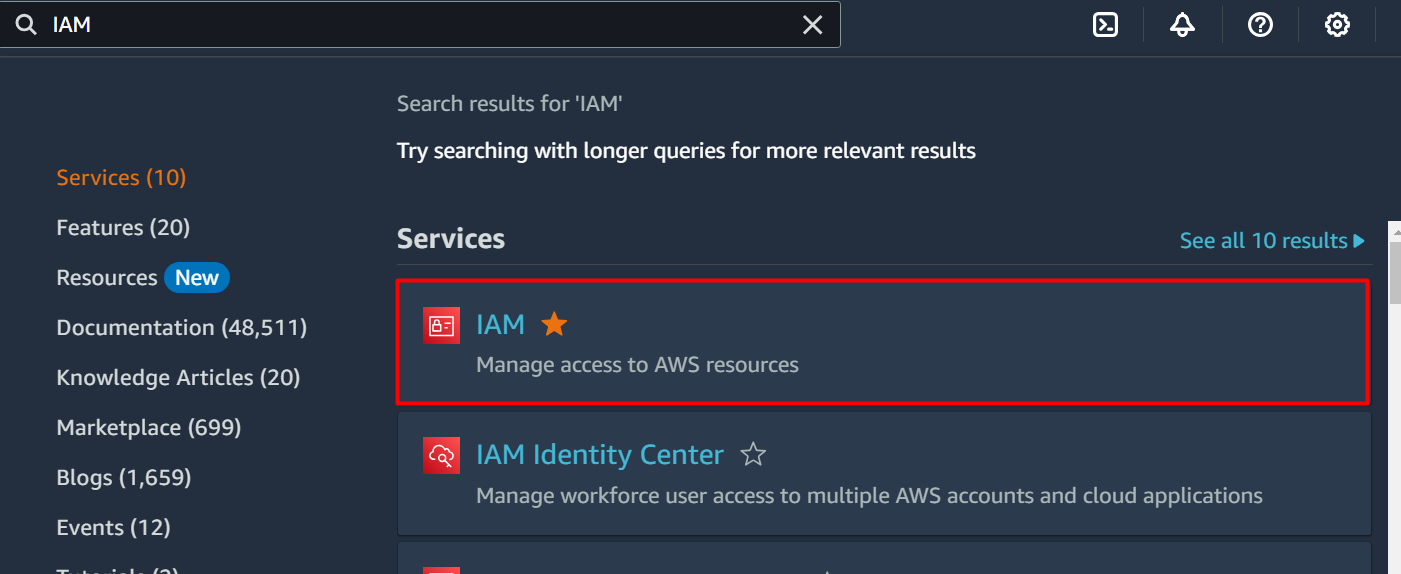
To create an IAM role, search the “IAM” service in the search bar of the AWS Management Console. Click on the service’s name from the displayed results:
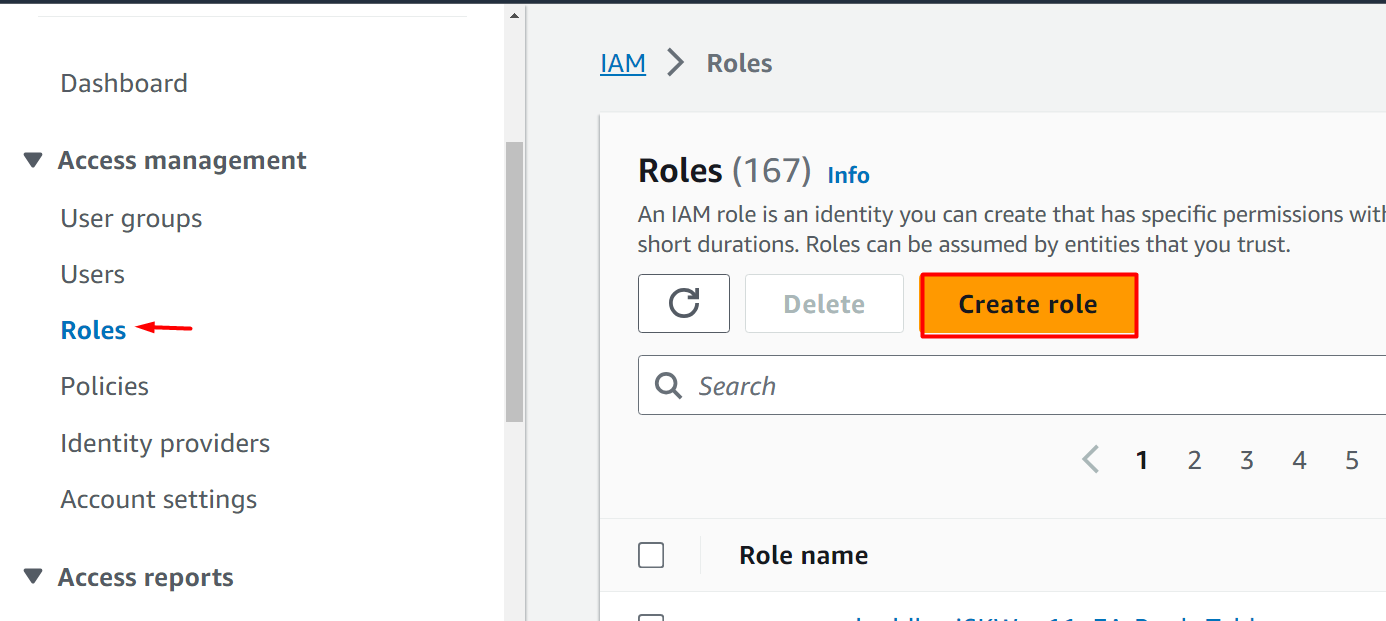
From the IAM Dashboard, click the “Roles” option from the left sidebar. This will display the “Roles” interface. Click the “Create role” button:
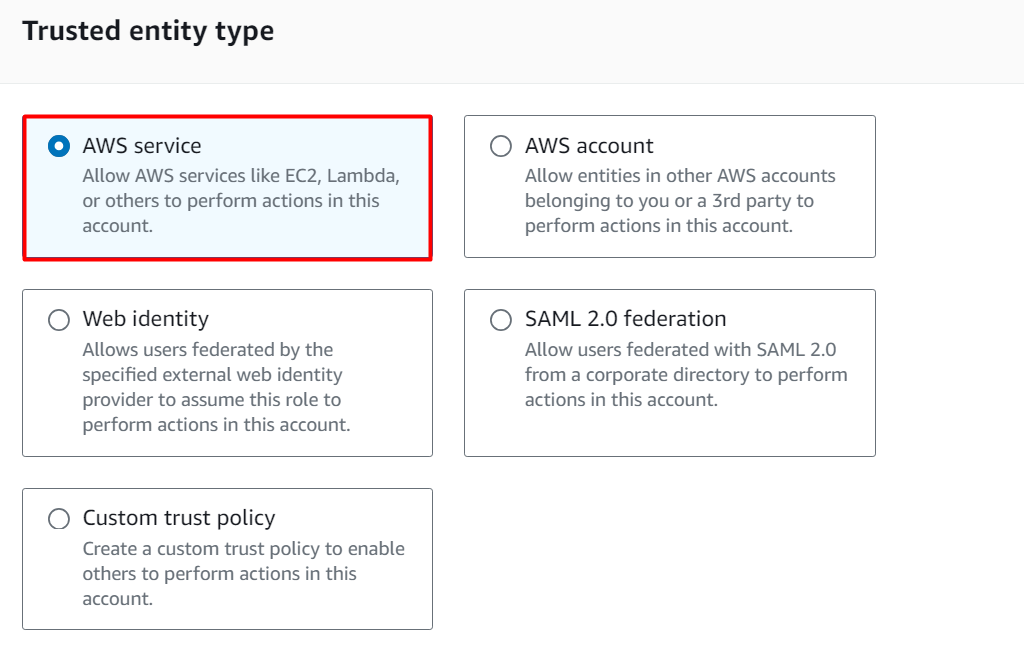
Next is the “Trusted entity type” interface. Pick the “AWS service” option as this role is being created for the EC2 instance:
Scroll down to the “Use case” section. Select the “EC2” service from the drop-down list of the “Service or use case” text field. Choose the “EC2” option from the different options displayed as highlighted in the below-attached snapshot:
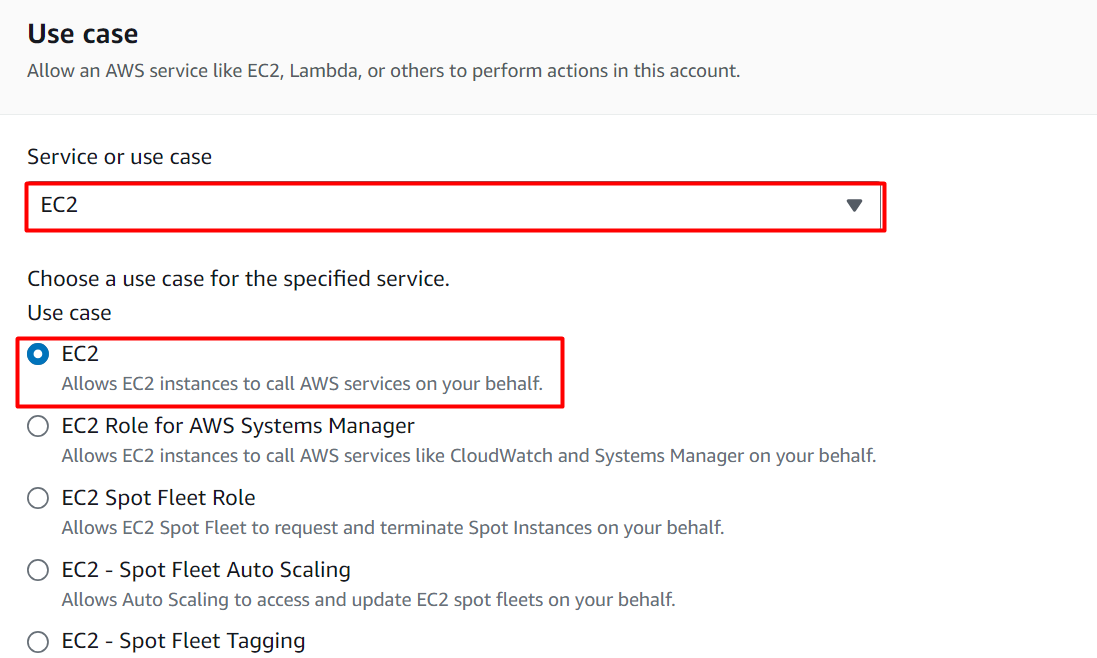
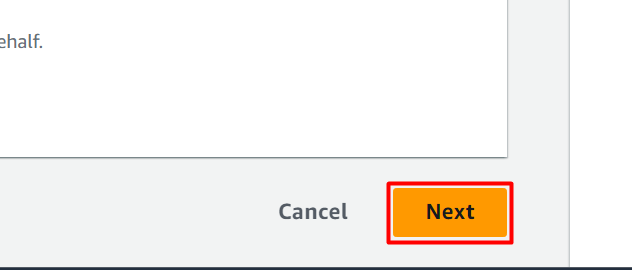
Tap the “Next” button to proceed further:
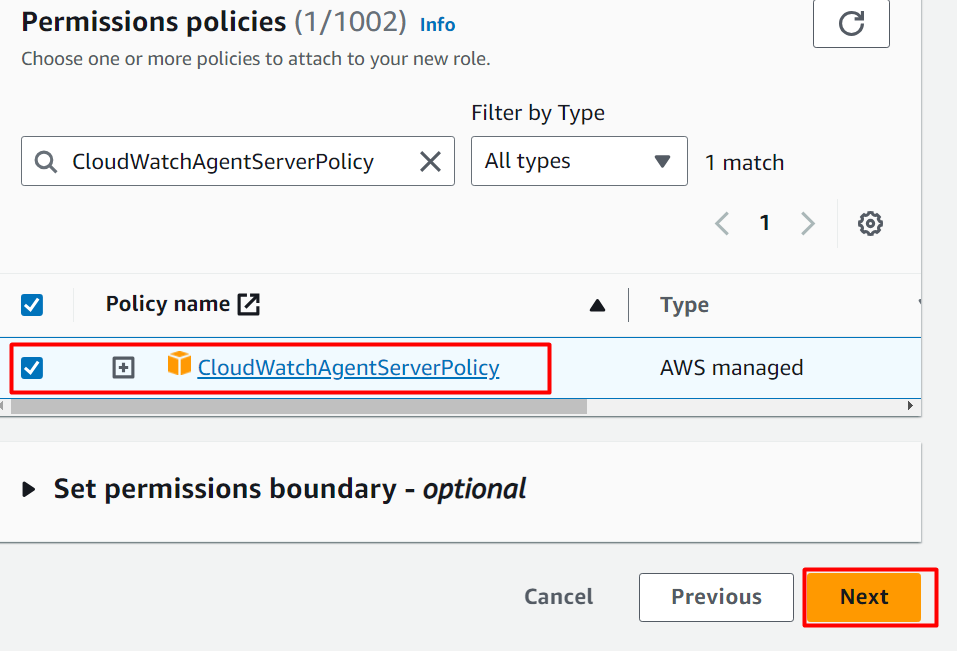
Search the “CloudWatchAgentServerPolicy” in the search bar and click on it from the results displayed. Select the following highlighted policy from the Permission policies interface and tap the “Next” button located at the bottom of the interface:
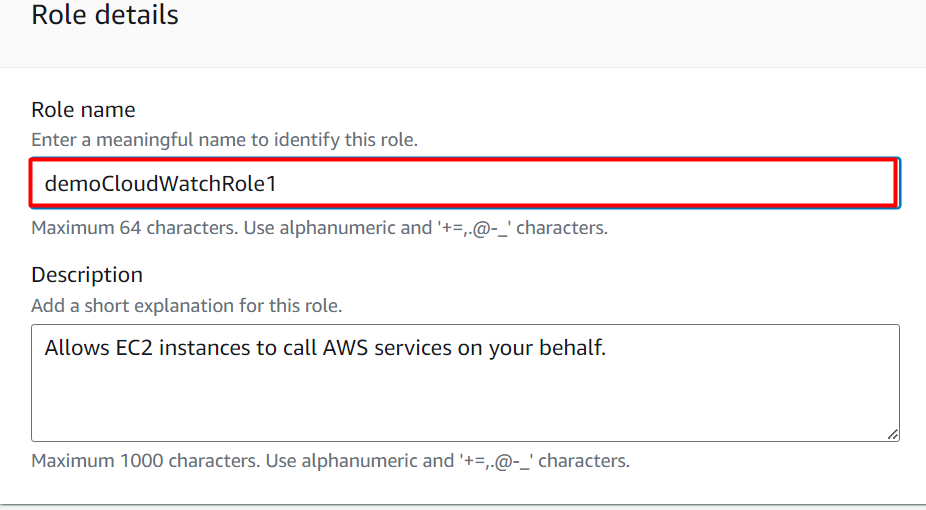
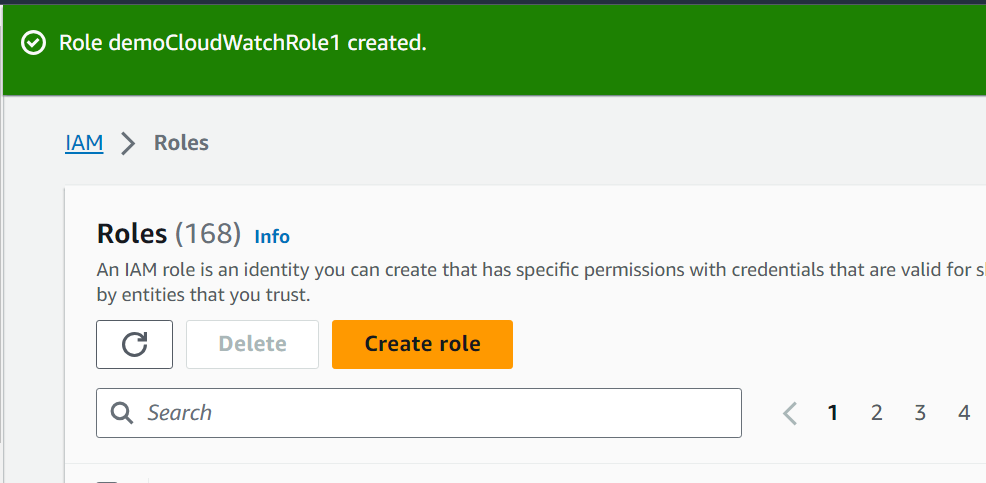
Provide a globally unique and meaningful name for the IAM role in the “Role name” text field. The Description text field is optional. However, the user can also provide a brief description of the IAM role:
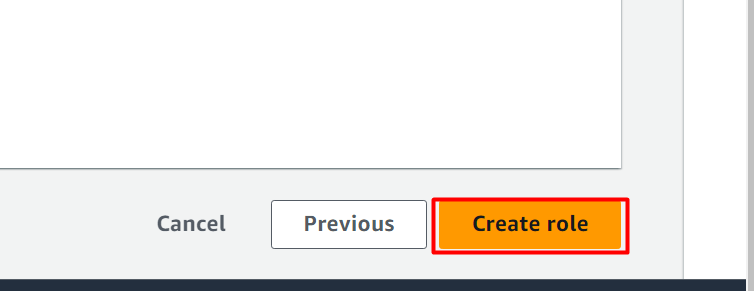
Scroll down to the bottom of the interface and click the “Create role” button:
The IAM role has been created successfully as indicated by the confirmation message from AWS:
Step 2: Create EC2 Instance
Next, we will create an EC2 instance. The IAM role will be attached to this EC2 instance. The log files created by this EC2 instance will be collected by the CloudWatch agent for monitoring and recording the resource activity.
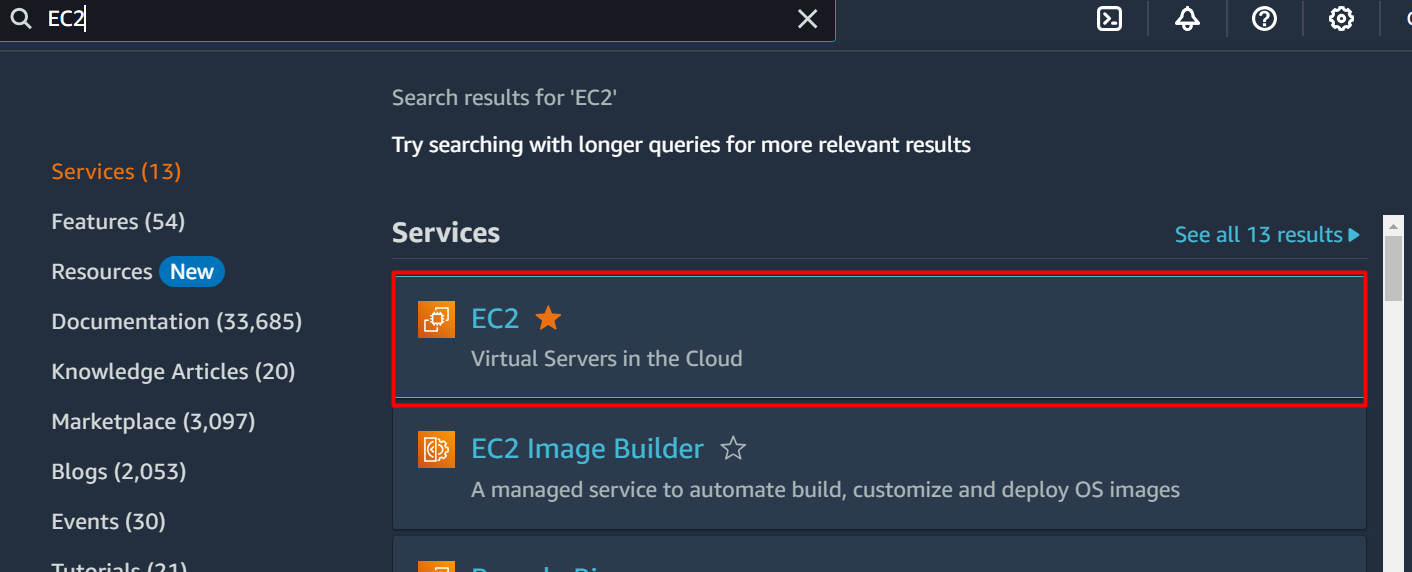
To create an EC2 instance, search and select the “EC2” service from the AWS Management Console:
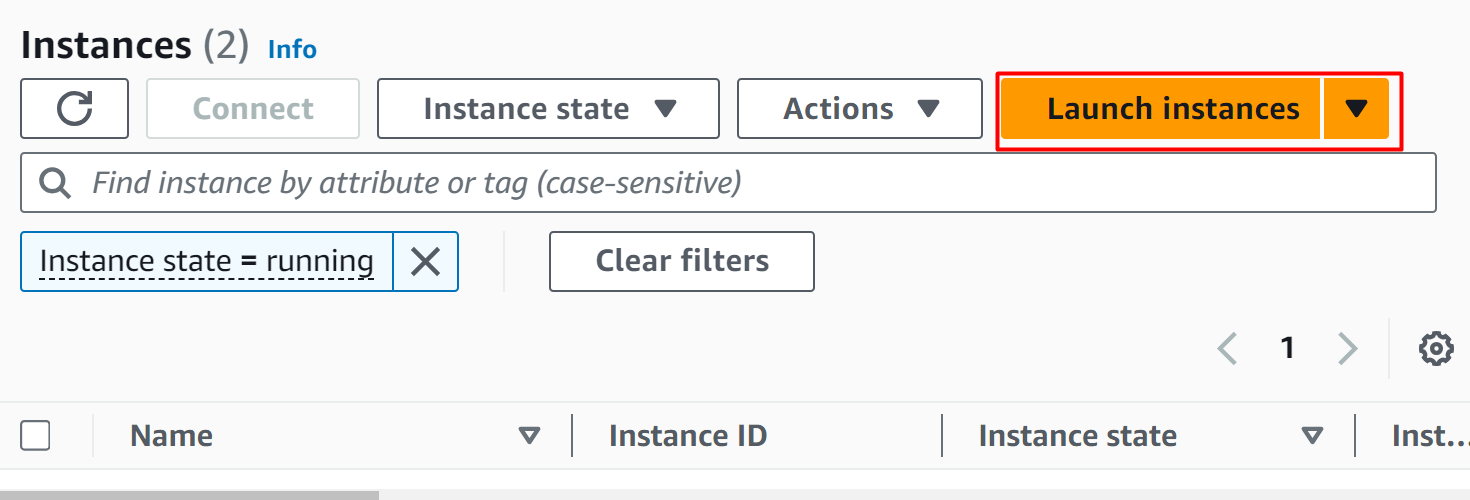
On the EC2 Dashboard, click on the “Launch instance” button:
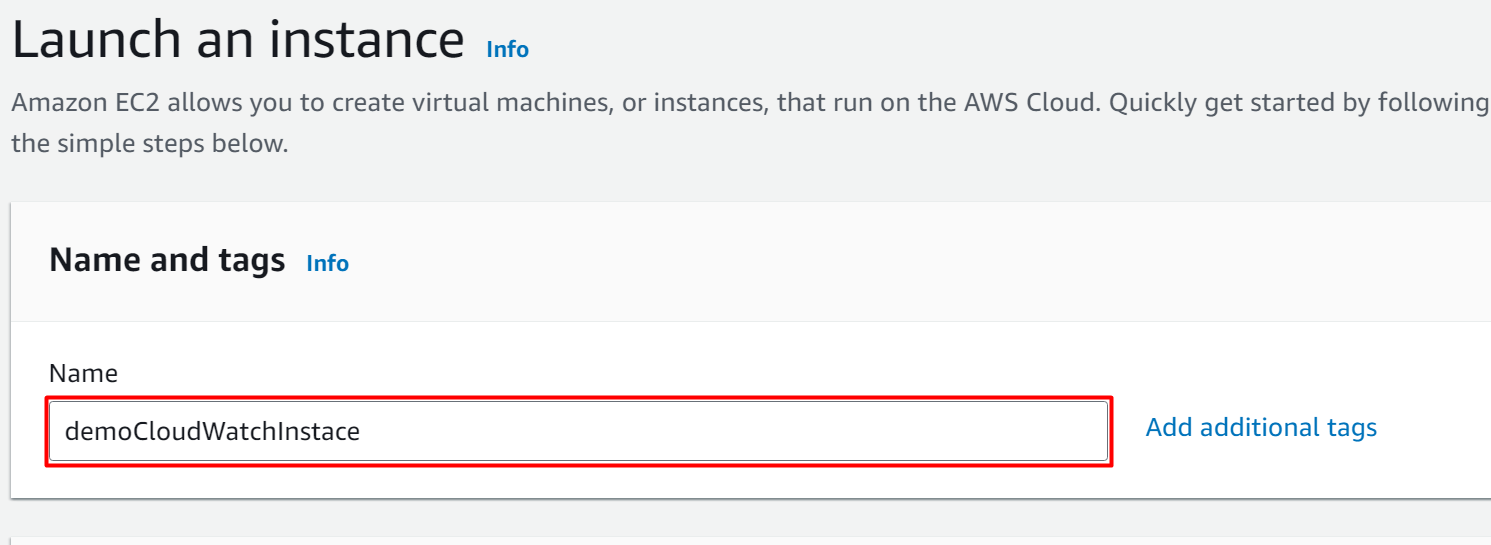
On the next interface, provide the “Name” of the EC2 instance:
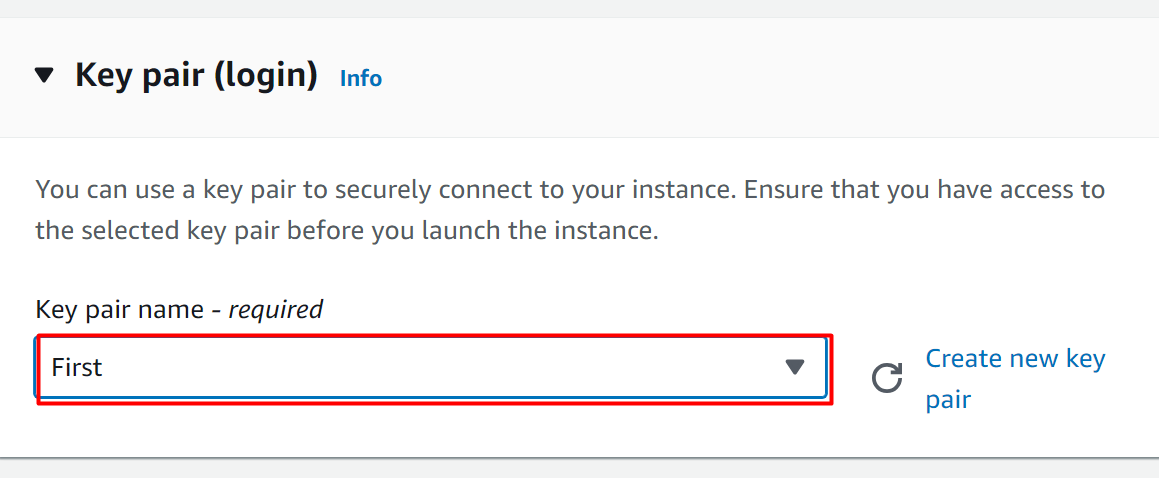
Scroll down to the Key pair section, the user can either create a new key pair, use an existing one, or proceed without creating any:
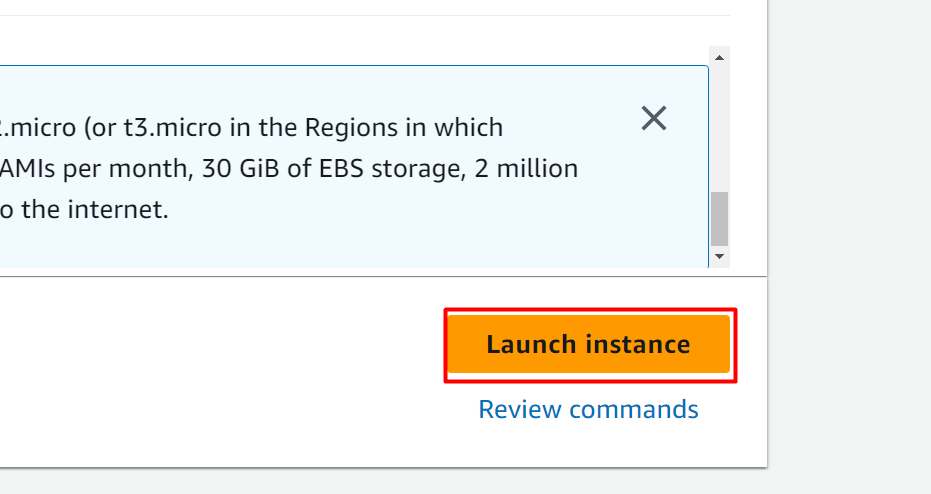
Keeping the rest of the settings as default, click on the “Launch instance” button:
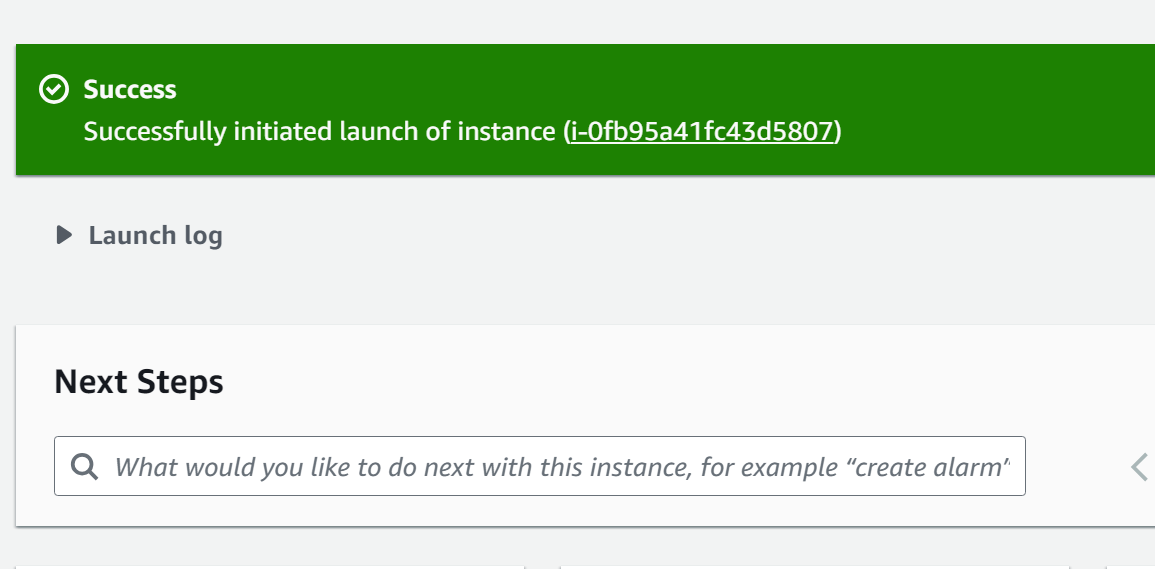
The instance has been created successfully:
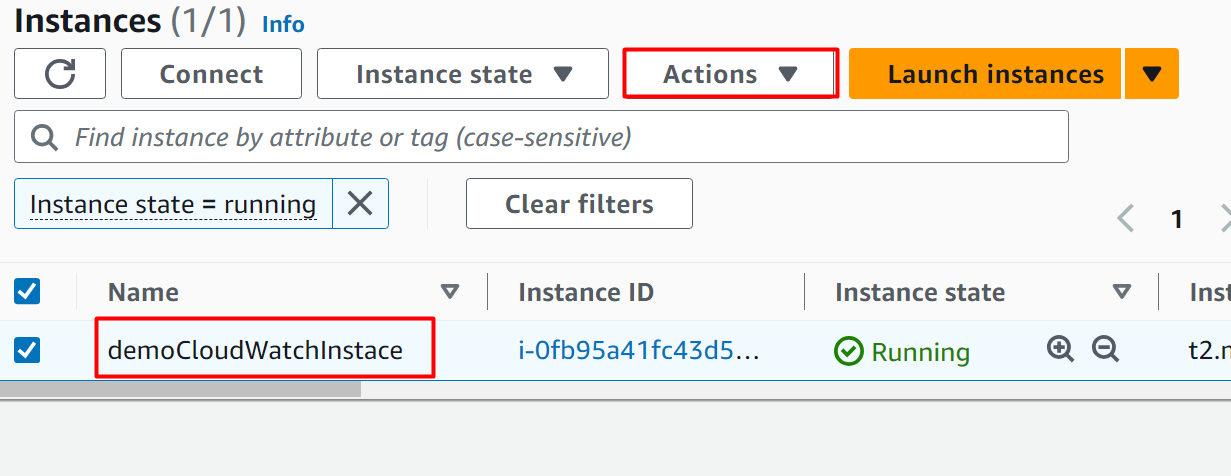
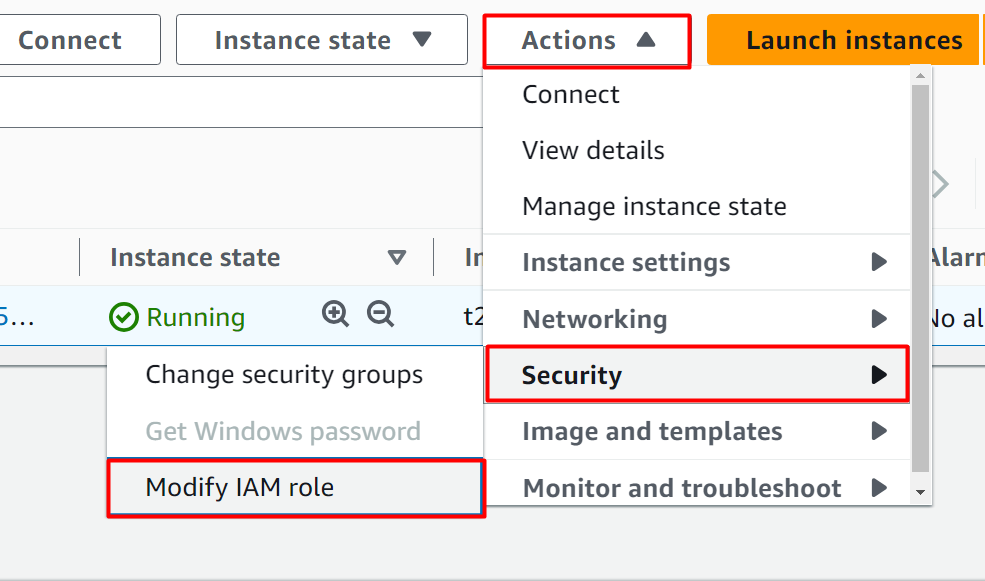
On the EC2 instance dashboard, choose the instance name and click the “Actions” button:
From the drop-down menu of the “Actions” button, select the “Security” button. Click the “Modify IAM role” option from the “Security” menu:
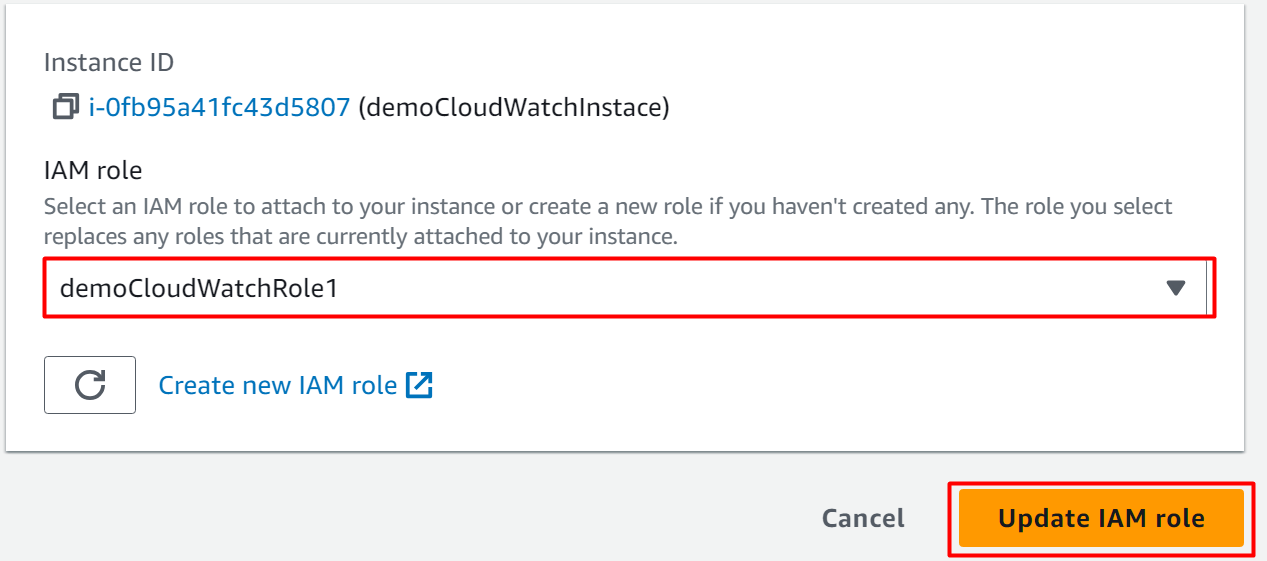
Select the IAM role created earlier in the first step. Tap the “Update IAM role” button to attach the IAM role to the EC2 instance:
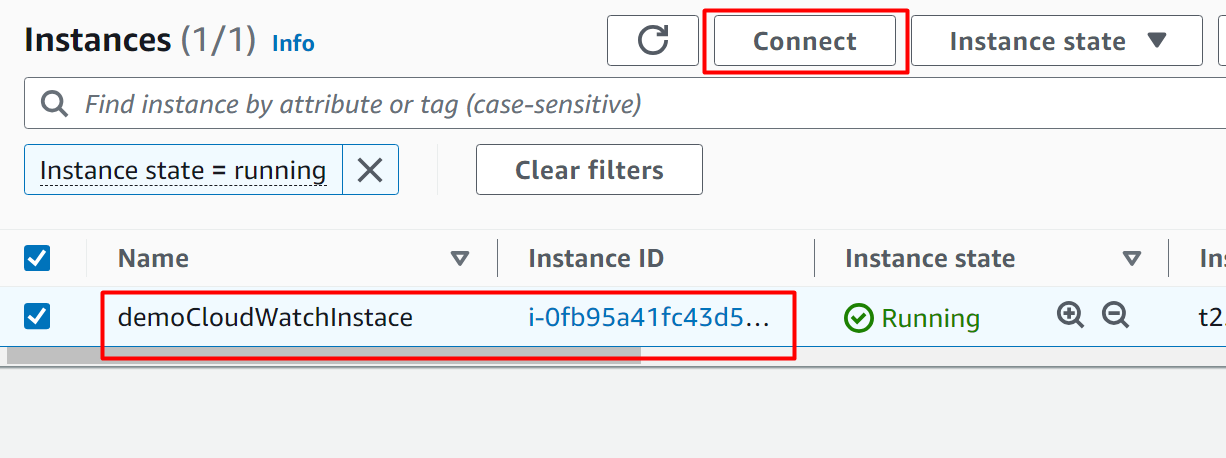
Next, choose the instance and click the “Connect” button from the EC2 instance dashboard:
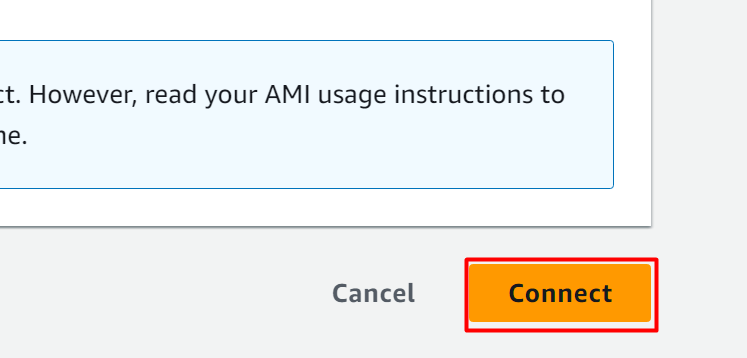
Scroll down to the bottom of the next interface and click the “Connect” button:
Step 3: Install CloudWatch Agent
In this section of the article, we will install the “CloudWatch Agent” on the EC2 instance.
After connecting the EC2 instance, the following terminal will appear. Provide the following command to the terminal for installing Java:
After the Java installation is complete, provide the following command to CLI for installing the Spring Boot application:
To create the logs, start this application by using the following command:
After the application is started, install the CloudWatch agent by providing the following command. While installing the CloudWatch agent on the EC2 instance, press “Y” for yes to install the recommended size of agent:
Next, we will configure the CloudWatch agent. For this purpose, provide the following command to the terminal and hit the “Enter” button:
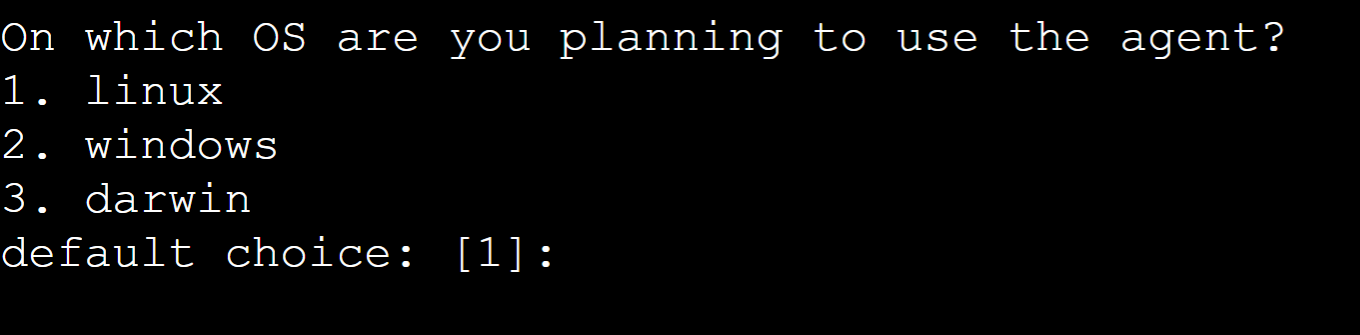
While installing the CloudWatch agent, it will ask a series of questions to make the required configurations. As the agent is getting installed on the Linux operating system, press the “Enter” button for the default choice:
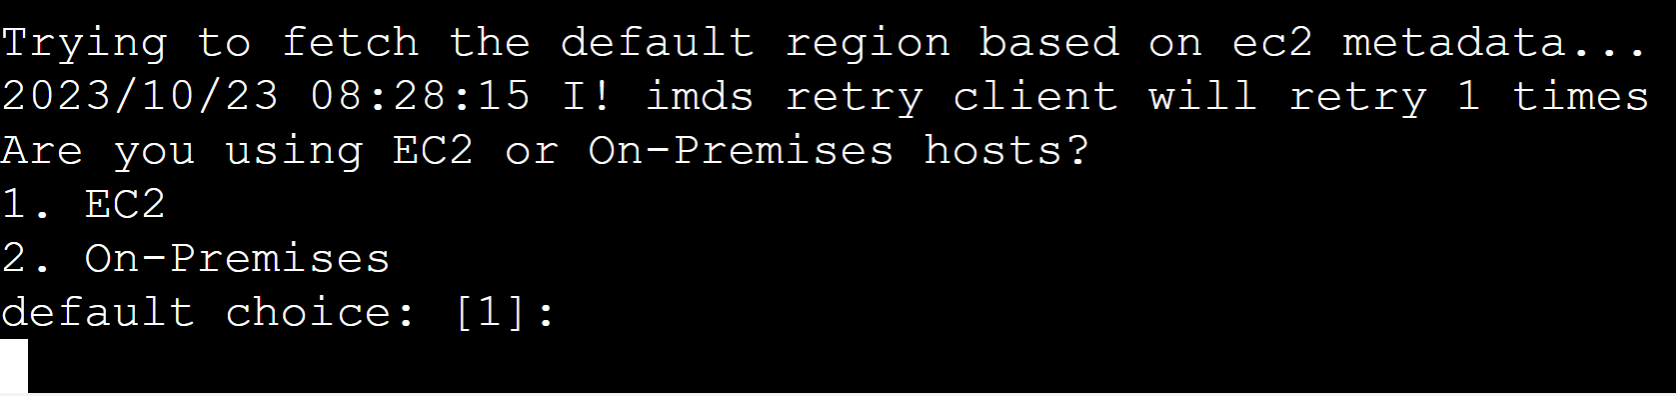
Press the “Enter” for the default choice i.e., EC2:
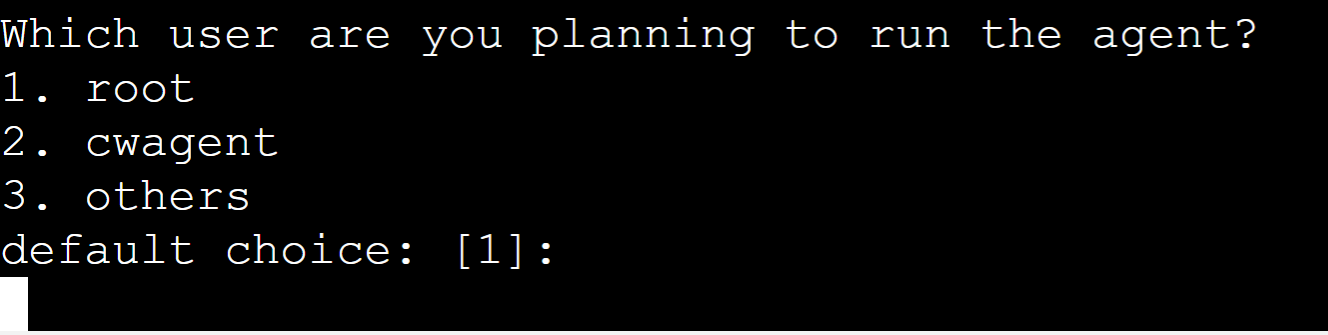
Currently, the agent is being installed for the root user. Therefore, press “Enter” for the default choice:
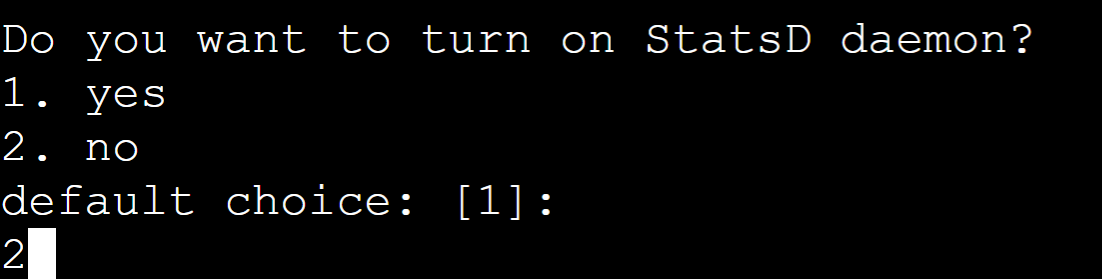
At the moment, we are not running the StatsD daemon. Therefore, press “2” from the keyboard:
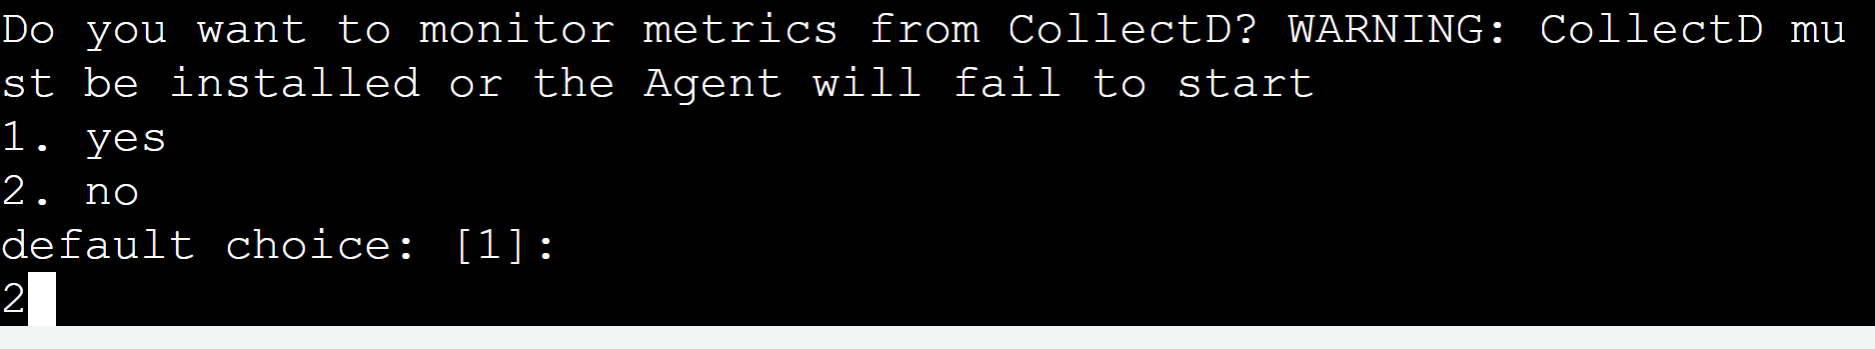
As for this demo, we do not want to monitor the metrics for CollectD. Therefore, press “2” from the keyboard:
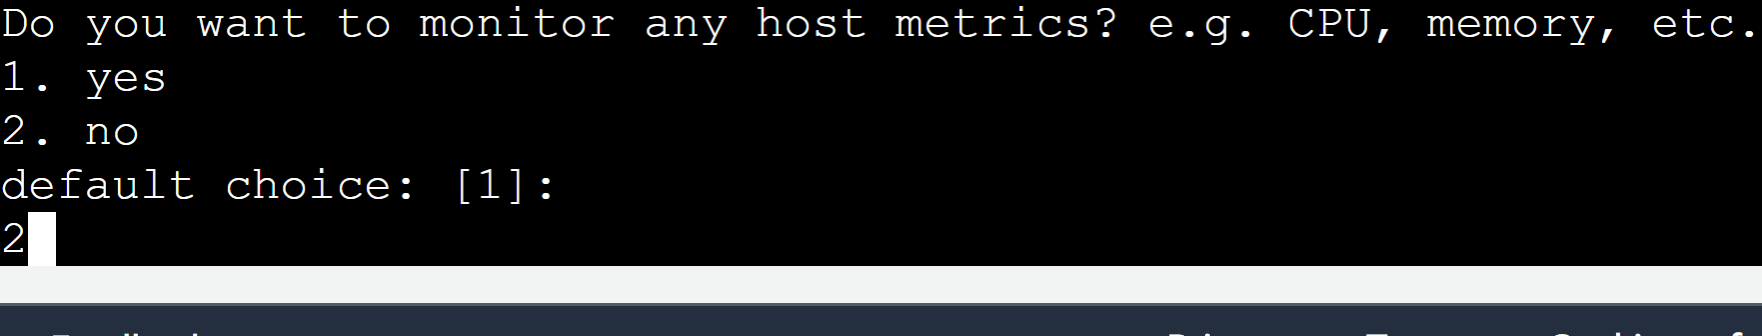
For the next question, we do not want to monitor the host metric. Press “2” from the keyboard:
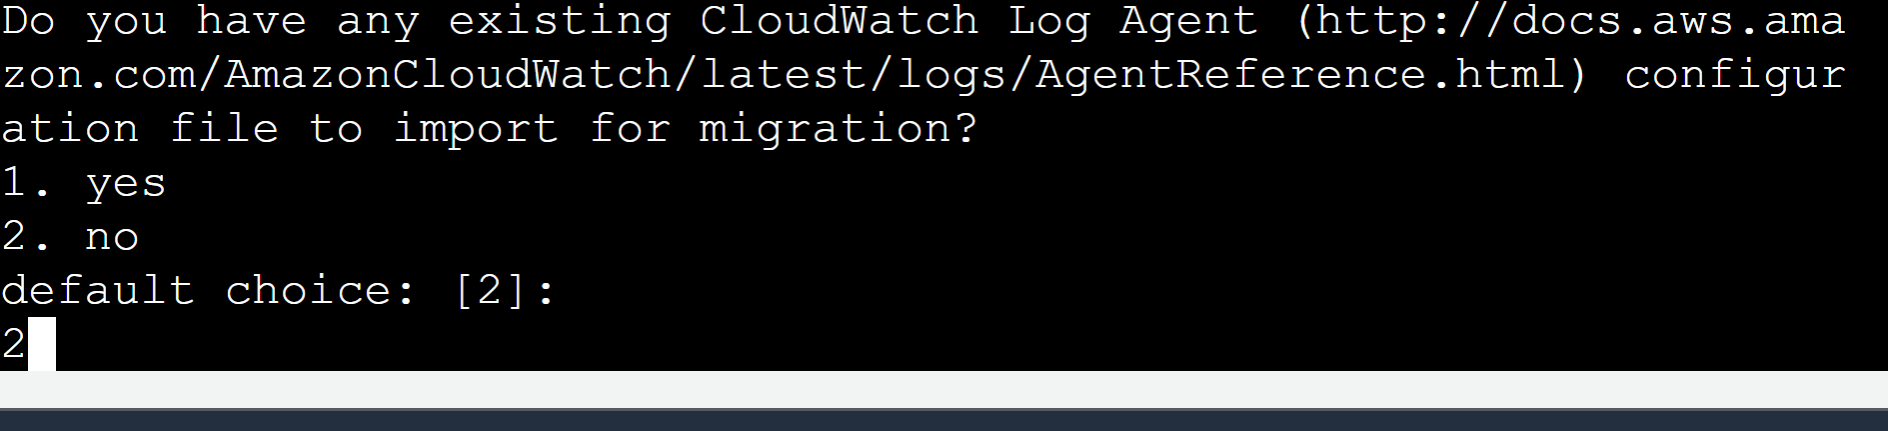
We do not have any CloudWatch agent installed on the EC2 instance. So, press the “2” button from the keyboard again:
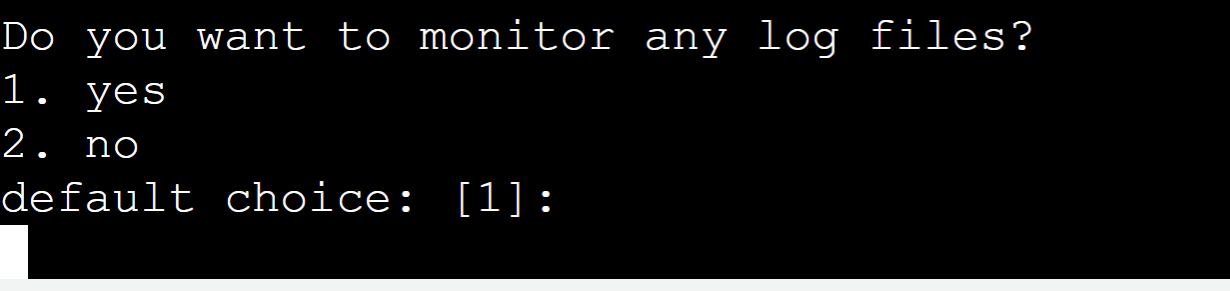
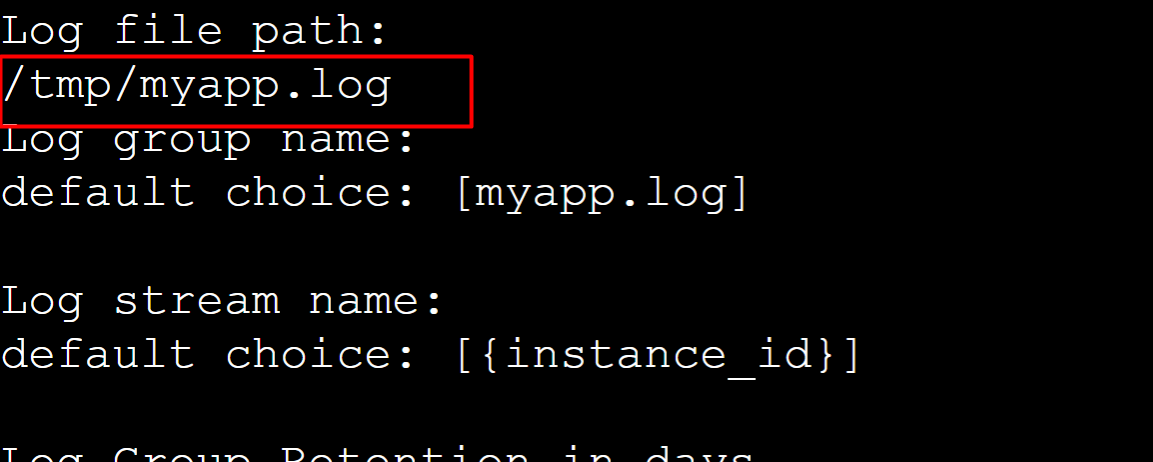
Press “Enter” for monitoring the log files:
For the path, we have provided “/tmp/myapp.log” and the rest of the settings will remain as default:
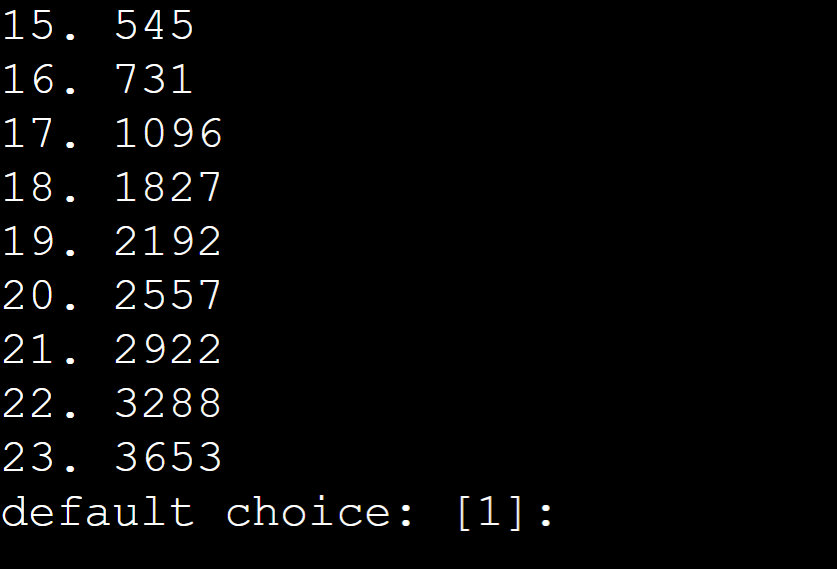
For the retention period, press “Enter” for the default settings:
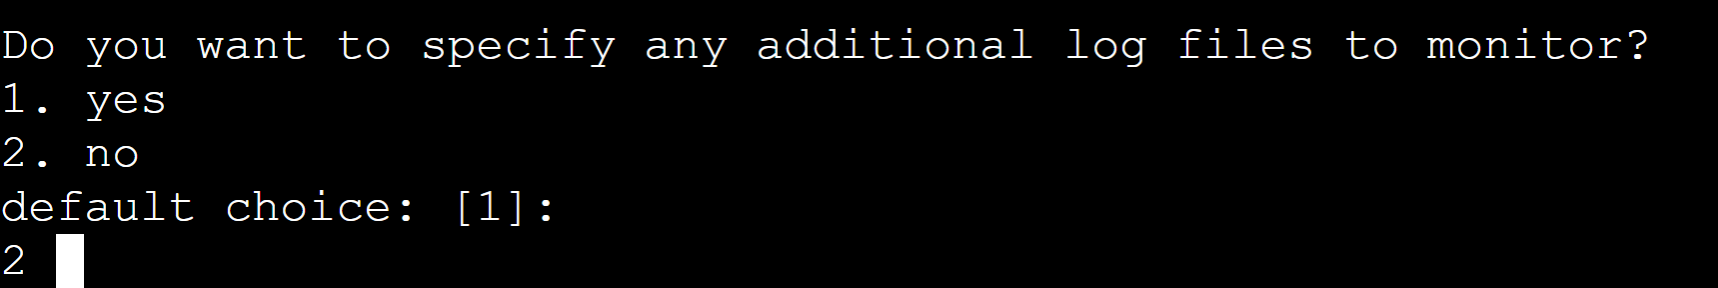
For this demo, we do not want to monitor any additional log files. Therefore, press the “2” button:
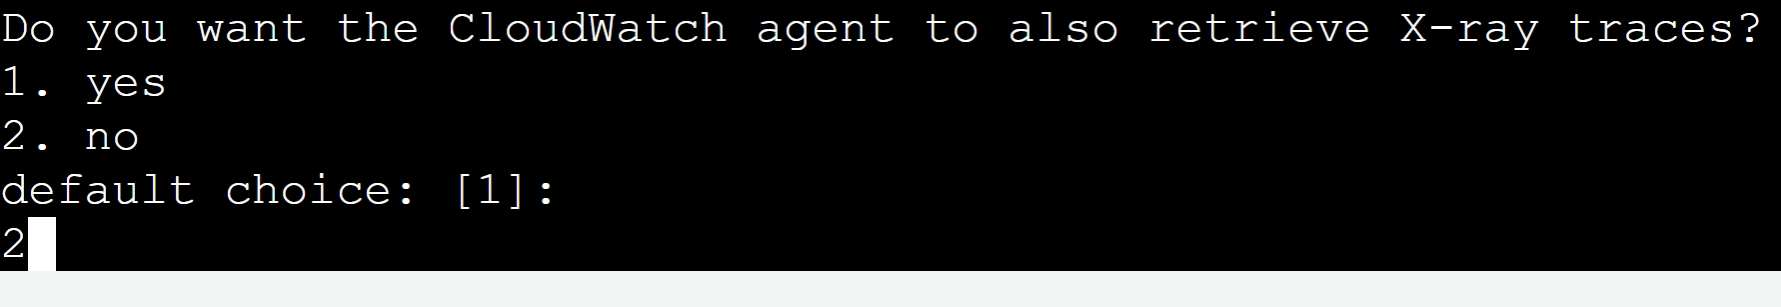
Similarly, press “2” from the keyboard as we do not want to monitor any X-ray traces:
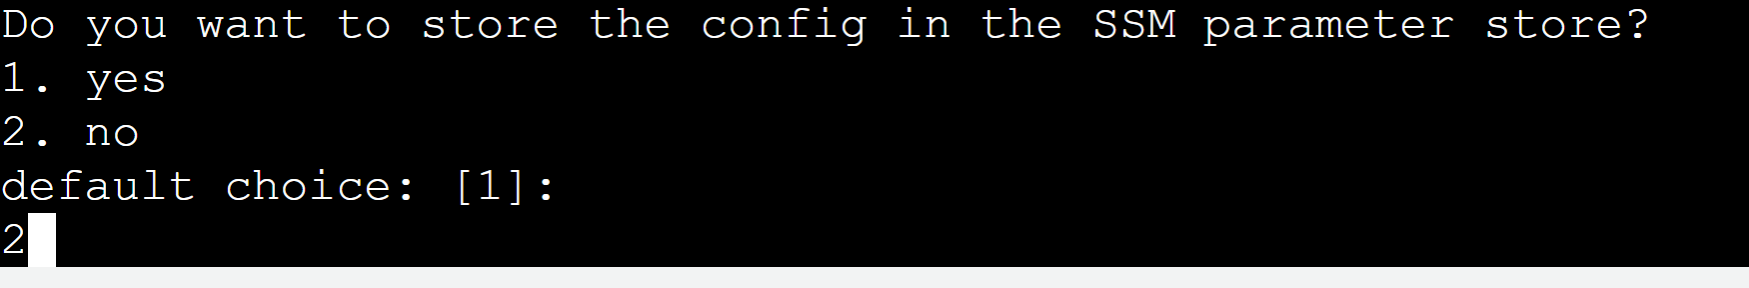
As we do not want to store the config in SSM, therefore, press “2” from the keyboard:
The CloudWatch agent has been configured successfully. Now, for the CloudWatch agent to collect the log files, first start the agent. For this purpose, use the following command:
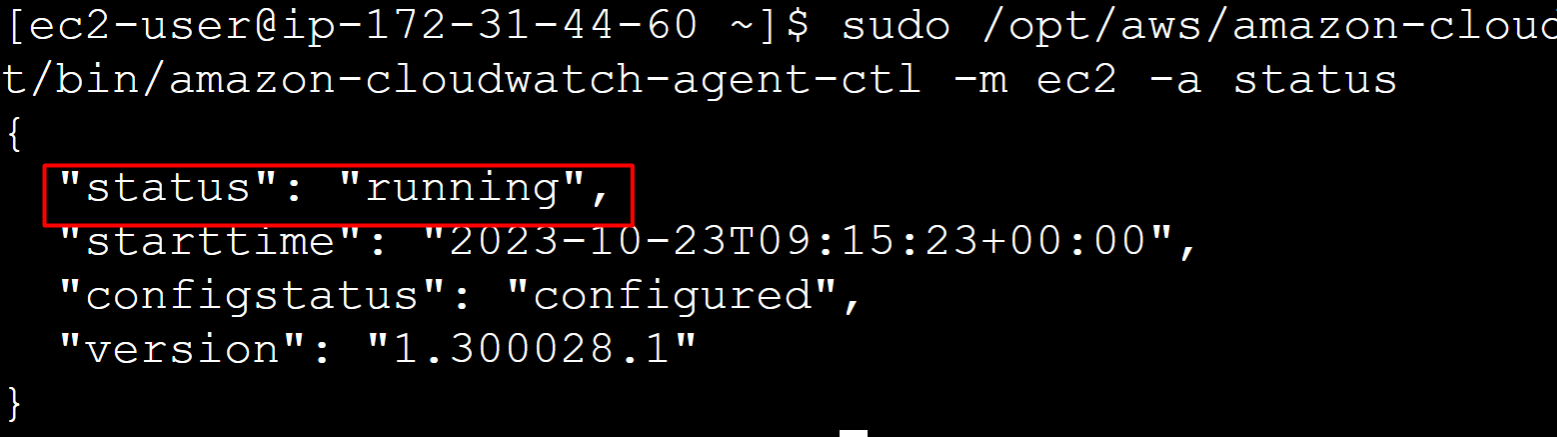
To check the status of the CloudWatch agent, use the following command:
This command will display the status of the CloudWatch agent which is “running”:
Step 4: Verification
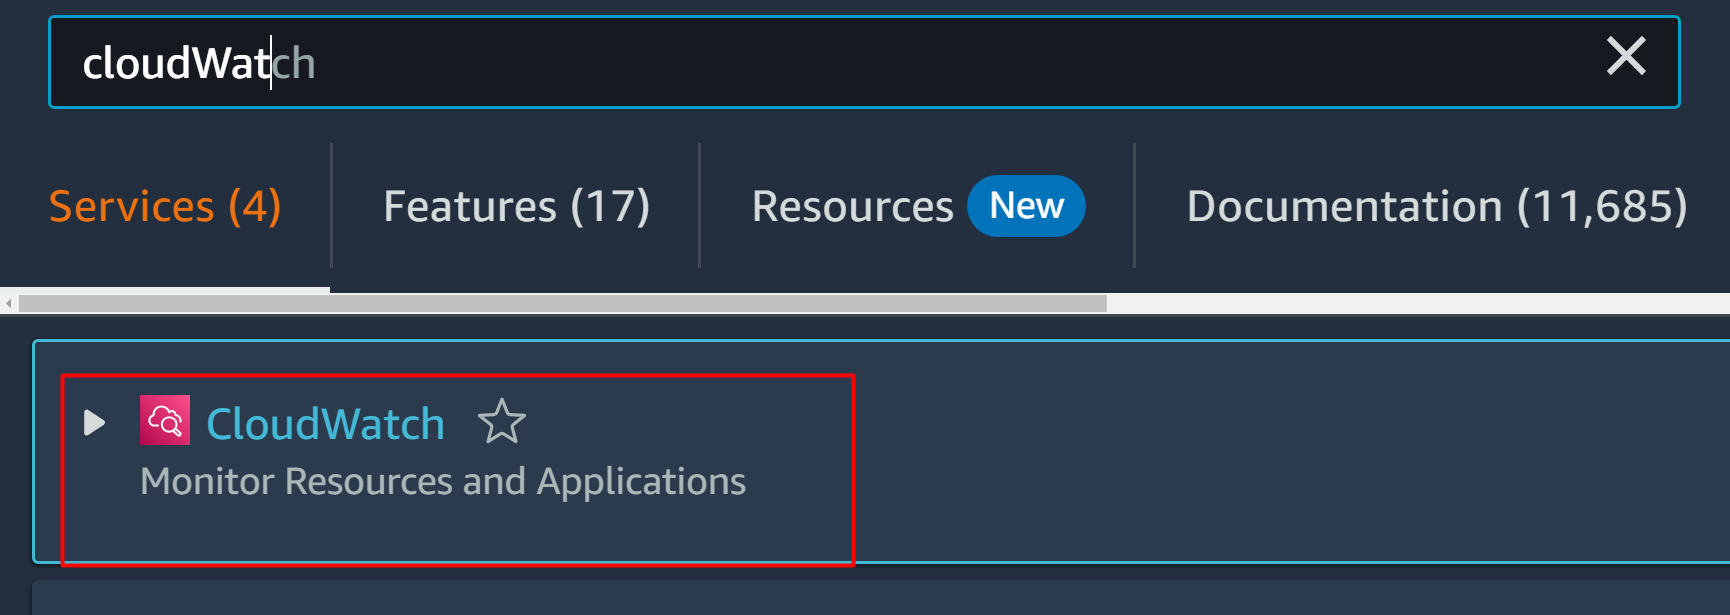
To verify if the CloudWatch agent is capturing all the log files for the EC2 instance, visit the CloudWatch Console. For this purpose, search and select the “CloudWatch” service from the AWS Management Console:
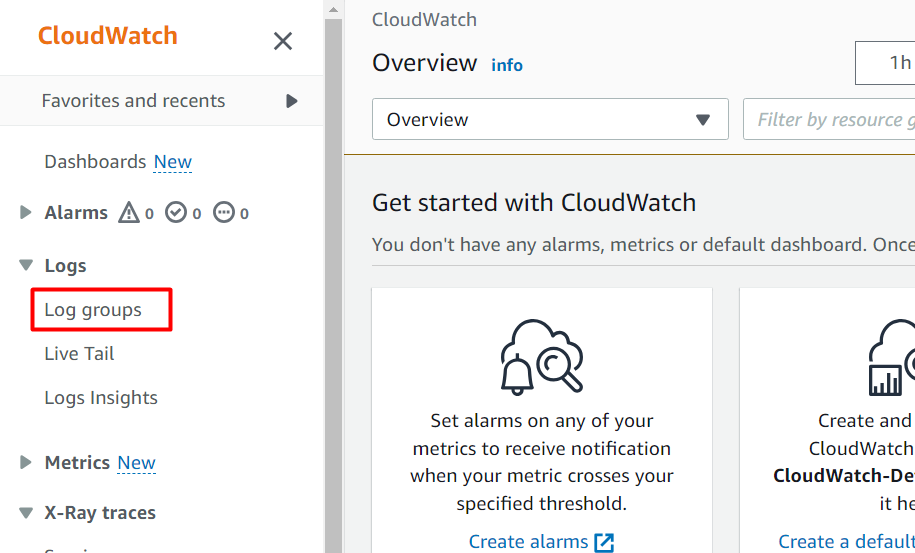
From the CloudWatch console, click the “Log groups” under the Logs section from the left sidebar:
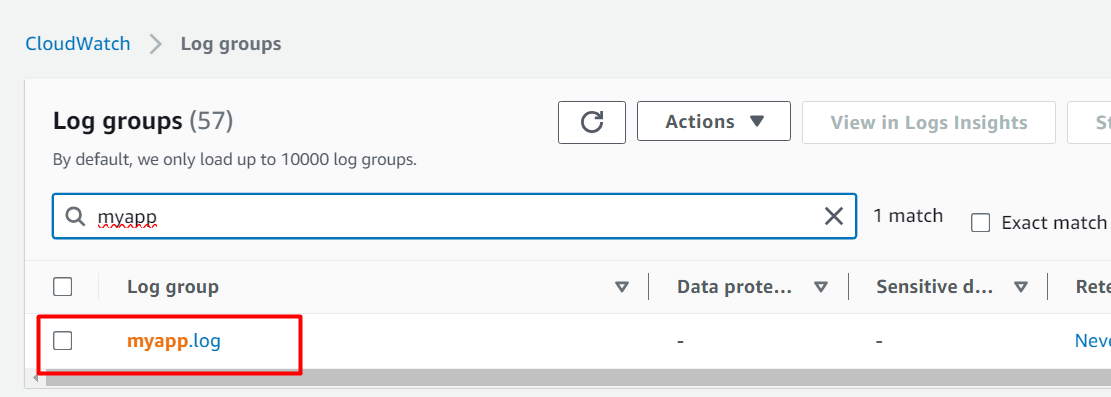
From the Log groups interface, search the “myapp.log” in the search bar. Click on the results to view the files:
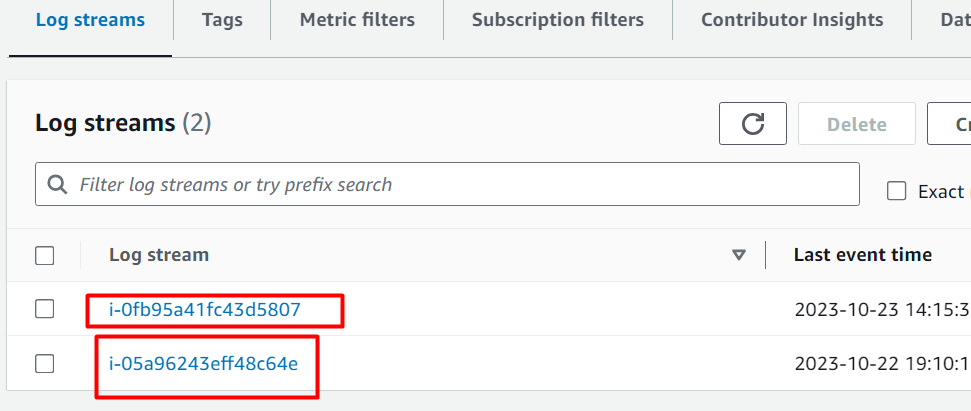
Scroll down to the “Log streams” section. The log files captured by the CloudWatch log are displayed in the “Log streams” section:
That is all from this guide.
Bonus Tip: Benefits of Centralized Logging Feature
Let’s take a look at the benefits of the Centralized Monitoring and Logging feature of AWS CloudWatch:
Centralized log File Storage
The log files of different resources across the account can be accessed from a unified location i.e., CloudWatch log stream’s dashboard.
Instant Debugging
By accessing these log files, users can instantly identify and debug the issue in the operational functionality of the application and resources instead of manually inspecting every instance.
Retention Period
In the CloudWatch, the users can specify the retention period for these log files. Similarly, these log files can be retained regardless of the state of the instance.
Conclusion
To use centralized logging with CloudWatch, install the CloudWatch agent with the required configurations on the EC2 instance with specified permissions. The user can access and view these log files from the Log Streams Dashboard of CloudWatch. This article provides a step-by-step demonstration of implementing centralized logging with Amazon CloudWatch.
Source: linuxhint.com