View and Access Threads in GDB
- It can automatically send notifications for newly created threads.
- It provides the ability to use the thread-no command to switch between several threads.
- The “info threads” command can be utilized to find out if there are any active threads.
- Using the “thread apply [threadno] [all] args” command, we can send the same command to several threads (or a tilt of threads).
- To figure out what happens when your program code crashes during execution, probe around inside your C applications.
- Only the binary or executable files that are created during the compilation process are compatible with GDB Debugger.
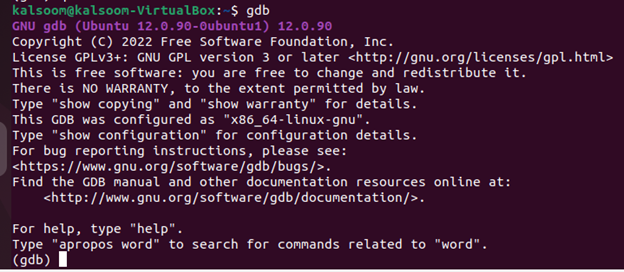
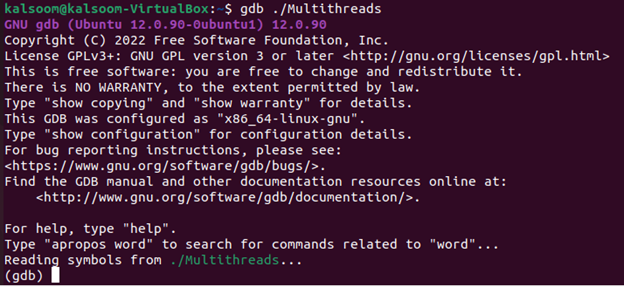
Just type gdb in the terminal window to access your operating system’s GDB on Ubuntu or any other Linux or UNIX-based operating system. The gdb command screenshot is shown in the following illustration. It shows the copyright details of the GDB. Gdb’s open prompt indicates the information regarding when it is prepared to accept commands. On some GDB configurations in which the OS enables the threads, these features aren’t yet accessible. These instructions have no impact on GDB that does not allow threading. For instance, a system that lacks a thread support ignores the result of the “info threads” query and consistently ignores the thread instruction.
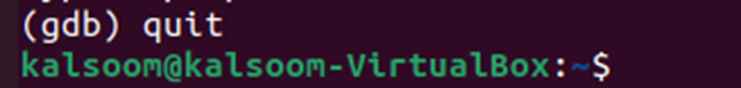
You just have to type the “quit” command in the gdb terminal to exit and end your current session of GDB. You can see the quit instruction on the gdb debugger as shown in the following:
The GDB debugger came up with many debugger commands. Here are some sample commands listed that we can try using the GDB debugger:
- run or r –> It completes the program’s execution from start to end.
- break or b –> It is used to place a breakpoint on a certain line or sentence.
- disable -> It disables a breakpoint that was marked previously.
- enable –> It enables a disabled breakpoint.
- next or n -> The next line of code is run, but avoid going directly into functions.
- step –> You should go on to the next instruction and start completing the function.
- list or l –> It displays the complete code of the C file.
- print or p –> It is used to print the value that was saved earlier.
- quit or q –> It exits out of the gdb debugger screen.
- clear –> It is used to remove all the marked breakpoints.
- continue –> It is used to continue to the normal execution of the program.
Example:
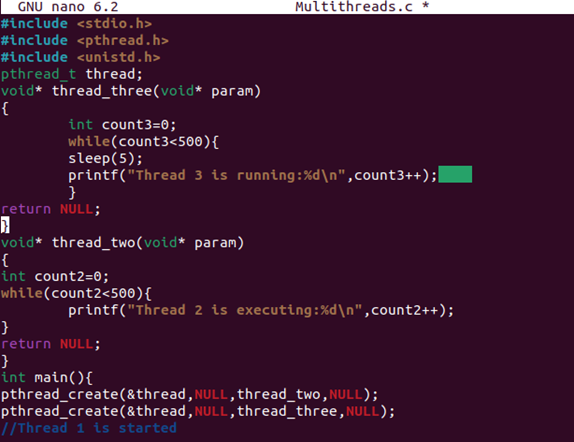
Here is a little piece of code that uses several threads, creates them with the pthread_create method, and passes the threads’ methods. The sample program has a main() function that creates two threads in the following illustration. There are now three threads running including the parent/original main() thread. The main() function uses the pthread_create() function to create the threads and call them one after another.
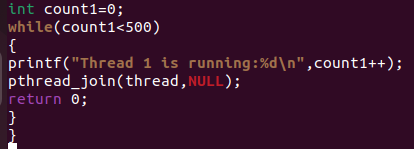
The while loop is checked in the following code to see if the count1 variable’s value is less than 500. If it is, the print statement is executed to display a “Thread 1 is running” string alongside the count variable. The thread is joined immediately after using the pthread_ join() function command in this code.
Use the following listed commands to compile the code using the GCC compiler and view the thread’s activity with the GDP debugger. The following image is a screenshot which shows that the previous code is successfully compiled:
- gcc –g Multithreads.c –o Multithreads -lpthread
![]()
While using Ubuntu 20.04 system, type the following command on the terminal screen to see and examine the thread.
-
$ gdb ./Multithreads
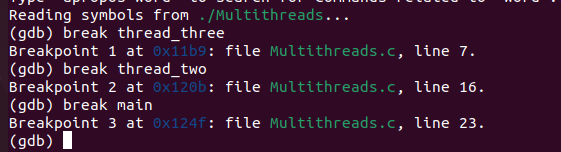
Now, we are in gdb debugging mode, thanks to the terminal window. To establish the breakpoints on the main, use the thread two and thread three routines of each newly formed thread. To insert a breakpoint, we use the following listed code. It is a simple command; just type the break. After that, write the name of the thread methods to insert the breakpoints. This method displays the line number where the breakpoints were added after entering.
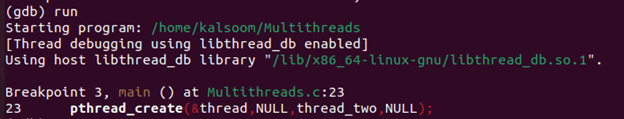
To run the program, use either the “run” or simple “r” keyword as a command on the terminal screen. An overview of the program’s threads and some information about their present condition are provided by the command info threads, as you should take note of. There has only been one thread started in this instance so far.
The execution should continue using the following command:
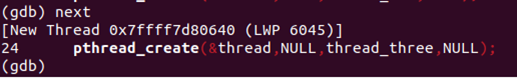
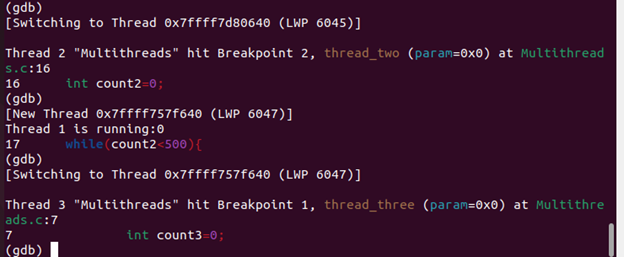
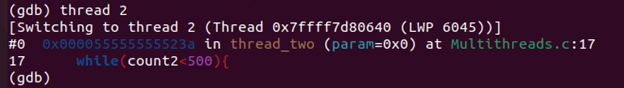
Two more threads start in this place. The thread that is currently in focus is denoted by a star. Additionally, the breakpoint set for the newly formed threads in their initialization methods is reached – thread two() and thread three(), specifically. Use the <thread thread_number> command to move the focus to another thread before starting an actual thread debugging. At line 17 of its function thread two, thread 2() halts.
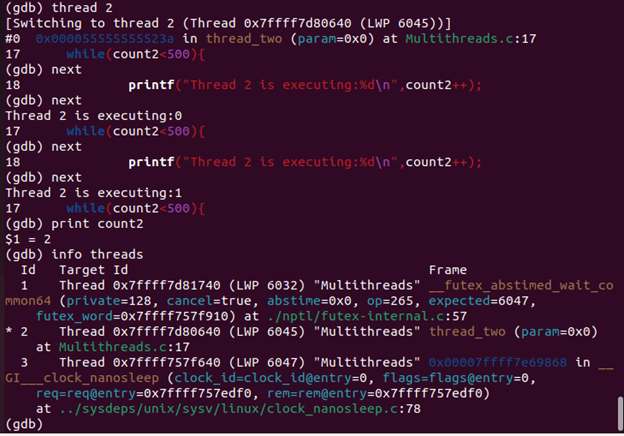
According to the output of the “info threads”, thread two briefly prints the counter count2 and then departs the thread 2 at line 17. Similarly, we can operate the “thread_three” thread using quite a similar way that we utilized for the thread_two.
Conclusion
To sum it up, we are finally able to use the gdb debugger in our Ubuntu 20.04 Linux system. For this, we explained its usage in the introductory paragraph and listed some of the main features that are provided to us and make it a unique debugger.
Source: linuxhint.com