SciPy Exponential Distribution
Python has made mathematical, statistical, and scientific computation extremely simple and easy by supporting simple to advanced libraries. The “Scipy” library in Python is used for several types of statistical operations. To work with exponential distribution the “scipy.stats.expon” module is used in Python. It is utilized to generate/create exponential distribution and contains multiple methods such as rvs(), pdf(), cdf(), and ppf() that are used with exponential distribution.
This guide will deliver a detailed guide on the “Scipy Exponential Distribution” using the below contents:
What is Exponential Distribution?
What is the “scipy.stats.expon” Module in Python?
- Example 1: Generate/Create Random Values From an Exponential Distribution
- Example 2: Determine the Probability Density Function of an Exponential Distribution
- Example 3: Determine the Cumulative Distribution Function of an Exponential Distribution
- Example 4: Determine the Percent Point Function of an Exponential Distribution
What is Exponential Distribution?
The exponential distribution is a continuous probability distribution that is widely used in statistics and probability theory to model the time between events in a Poisson process. A Poisson process is a stochastic procedure in which events happen independently and randomly at a stable average rate.
The exponential distribution has one argument/parameter “λ” and it is known as the rate parameter/inverse scale parameter. The parameter “λ” specifies the average rate of events or average number of events per unit time. The higher the value of the “λ” the more frequent the events are, and the shorter the time between them.
Probability Density Function
The probability density function “PDF” of the specified exponential distribution is shown below:
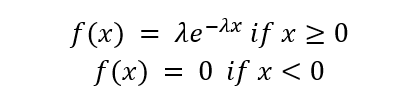
The PDF shows how likely a given value of x is for a random variable that follows an exponential distribution. The PDF has a characteristic shape that starts at “λ” and decreases exponentially as x increases. The PDF can be utilized to define the probability of an event happening in a provided interval.
Cumulative Distribution Function
The CDF of the exponential distribution is shown below:
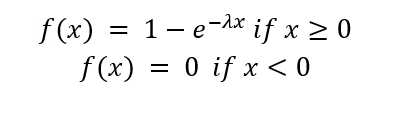
The CDF shows the probability that a random variable that follows an exponential distribution is less than or equal to a given value of x. The CDF can be used to determine the probability of an event occurring before a given time.
What is the “scipy.stats.expon” Module in Python?
The “scipy.stats.expon” module in Python is a submodule of the “scipy.stats” module that provides functions and methods for working with exponential distributions. The “scipy.stats” module of the scipy library is a collection of Python scientific computing tools.
The “scipy.stats.expon” module is used to create exponential distribution objects, generate random samples from an exponential distribution, determine various statistics, and perform hypothesis tests. These operations can be performed using different methods of the “scipy.stats.expon” module.
The “expon()” method retrieves a “rv_continours” object, which is a generic object for continuous random variables. The “rv_continous” object has several methods and attributes that can be used to work with exponential distributions such as, rvs(), pdf(), cdf(), ppf(), and others.
- rvs(): This generates/creates random samples from the distribution.
- pdf(): It calculates the probability density function at a given point or array of points.
- cdf(): This determines the cumulative distribution function at a given point or array of points.
- ppf(): This determines the percent point function (inverse of the CDF) at a given probability or array of probabilities.
Example 1: Generate/Create Random Values From an Exponential Distribution
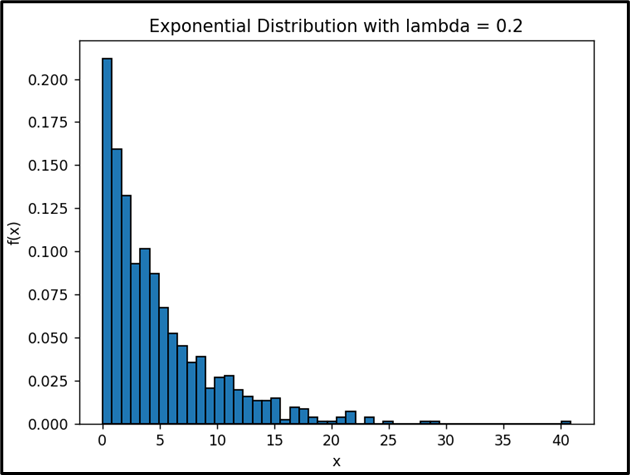
We can generate random values from an exponential distribution utilizing the “rvs()” method. Let us consider the below code, in which we generate “1000” random values from an exponential distribution:
import scipy.stats
import matplotlib.pyplot as plt
numpy.random.seed(42)
exp_dist = scipy.stats.expon(scale=1 / 0.2)
y = exp_dist.rvs(size=1000)
plt.hist(y, bins=50, density=True, edgecolor='black')
plt.xlabel('x')
plt.ylabel('f(x)')
plt.title('Exponential Distribution with lambda = 0.2')
plt.show()
In the above code:
- The “numpy”, “scipy.stats” and “matplotlib.pyplot” modules are imported.
- The “numpy.random.seed()” is used to seed the random number with the value “42”.
- Next, the “scipy.stats.expon()” method creates an exponential distribution object with the scale parameter value “1/0.2”. The scale parameter determines the average rate at which events occur in an exponential distribution.
- After that, we generate “1000” random samples from the exponential distribution using the “rvs()” method.
- To show the distribution of the samples, the “plt.hist()” method is used along with the other method plotting method.
Output
Example 2: Determine the Probability Density Function of an Exponential Distribution
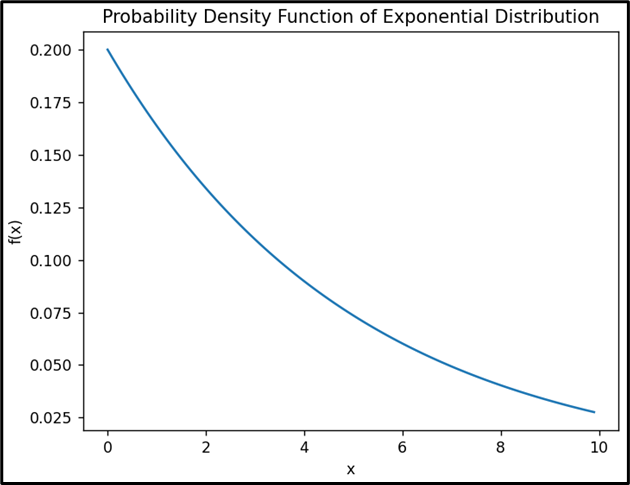
In the following example, we first imported the necessary libraries. After that, we create the exponential distribution object with scale parameter value. Next, we create the NumPy arrays of values from 0 to 10 with a step size of 0.1 using the “numpy.arange()” method and pass them to the “pdf()” function. The pdf() function determines the probability density function of the exponential distribution at each value in the NumPy array. Lastly, we plot the PDF of the exponential distribution utilizing the plot() method.
import scipy.stats
import matplotlib.pyplot as plt
exp_dist = scipy.stats.expon(scale=1 / 0.2)
x = numpy.arange(0, 10, 0.1)
y = exp_dist.pdf(x)
plt.plot(x, y)
plt.xlabel('x')
plt.ylabel('f(x)')
plt.title('Probability Density Function of Exponential Distribution')
plt.show()
The above code displays this:
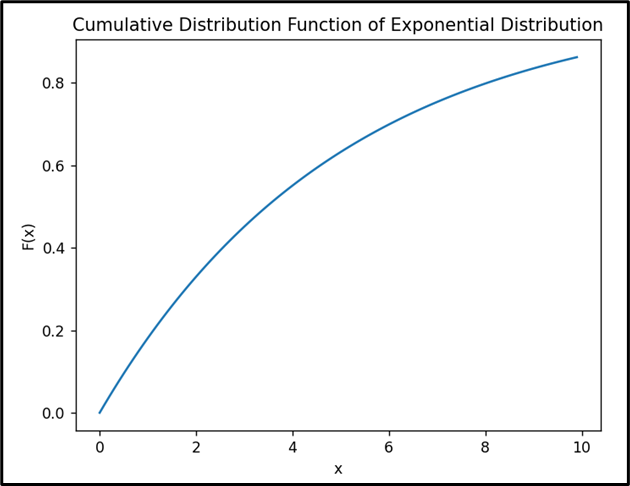
Example 3: Determine the Cumulative Distribution Function of an Exponential Distribution
The below code determines and plots the cumulative distribution function of the specified exponential distribution. Here, first, we import the necessary libraries and create an exponential object using the “expon()” method. Next, we create a NumPy array of x-values and determine the CDF of the exponential distribution at each x-value using the “cdf()” method. Lastly, we plot the CDF of the exponential distribution against the x-values and add labels and titles.
import scipy.stats
import matplotlib.pyplot as plt
exp_dist = scipy.stats.expon(scale = 1/0.2)
x = numpy.arange(0, 10, 0.1)
y = exp_dist.cdf(x)
plt.plot(x, y)
plt.xlabel('x')
plt.ylabel('F(x)')
plt.title('Cumulative Distribution Function of Exponential Distribution')
plt.show()
Here is the output:
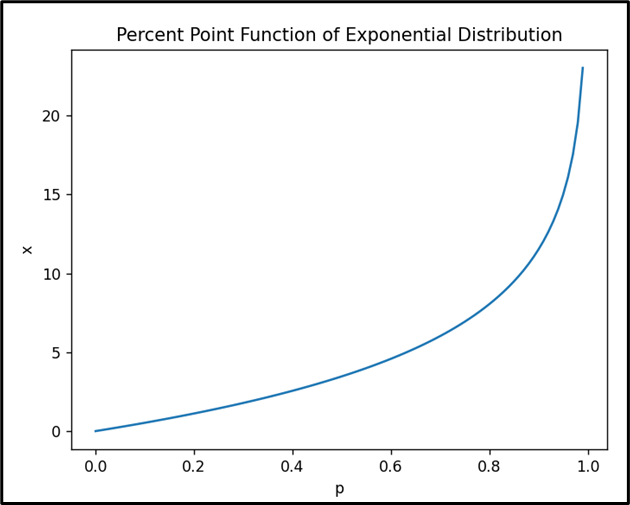
Example 4: Determine the Percent Point Function of an Exponential Distribution
In this example, we determine and plot the PPF of an exponential distribution. The “scipy.stats.expon.ppf()” method is used to determine the PPF of the given exponential distribution for each probability value in the array. Lastly, after calculating, we plot the distribution using the plot() method.
import scipy.stats
import matplotlib.pyplot as plt
exp_dist = scipy.stats.expon(scale = 1/0.2)
p = numpy.arange(0, 1, 0.01)
x = exp_dist.ppf(p)
plt.plot(p, x)
plt.xlabel('p')
plt.ylabel('x')
plt.title('Percent Point Function of Exponential Distribution')
plt.show()
The above code displays this output:
Conclusion
The “scipy.stats.expon” module of the “scipy” is used to work with the exponential distribution, which is a type of continuous probability distribution. We have calculated and plotted the probability density function, cumulative distribution function, percent point function, and others using the “scipy.stats.expon” module. The “scipy.stats.expon” is used with the “rvs()” method to generate/create random samples from an exponential distribution. This article provided a broad overview of the scipy exponential distribution, using a variety of examples.
Source: linuxhint.com