Plotly.graph_objects.choroplethmapbox
When working with statistical analysis, you often encounter scenarios where you must plot a choropleth map.
Therefore, this article will discuss how you can create a choropleth Mapbox using Plotly’s graph_objects.
Plotly.graph_objects.chroplethmapbox()
The choroplethmapbox() class from Plotl’y graph_objects allows us to create a Choroplethmapbox object with specific properties and customization.
The syntax is shown below:
The following are several essential properties you will use when using the Choroplethmapbox:
- Arg – specifies the properties of the choroplethmapbox object as a dictionary.
- Geojson – specifies the GeoJSON data associated with the choroplethmapbox.
- autocolorscale – sets the color scale palette, such as default or custom. This is a Boolean value.
- Geojson – specifies the GeoJSON data required for the choropleth trace. If no value is determined, Plotly will use the default base map.
- Locations – sets the coordinate using the location IDs or names.
- Locationmode – this parameter specifies the sets of locations used to match the entries in the location’s parameter.
- Colorscale – specifies the color scale as an RGB array.
- Hoverinfo – specifies the information that appears on the trace on mouse hover.
- Text – specifies the text elements that are associated with each location.
- Uid – assigns a unique ID of the choropleth trace.
- Z – specifies the color values.
- Name – specifies the choropleth trace name.
- Meta – provides extra metadata information associated with the Choropleth.
- Visible – sets if the choropleth object is visible or not.
- Ids – assigns a label to each column.
You will notice that it shares similar properties as a choropleth map.
Example 1
The following example illustrates how we can create a choroplethmapbox using the Choroplethmapbox class from Plotly’s graph_objects:
import json
import plotly.graph_objects as go
import pandas as pd
with urlopen('https://raw.githubusercontent.com/plotly/datasets/master/geojson-counties-fips.json') as response:
counties = json.load(response)
df = pd.read_csv("https://raw.githubusercontent.com/plotly/datasets/master/fips-unemp-16.csv",
dtype={"fips": str})
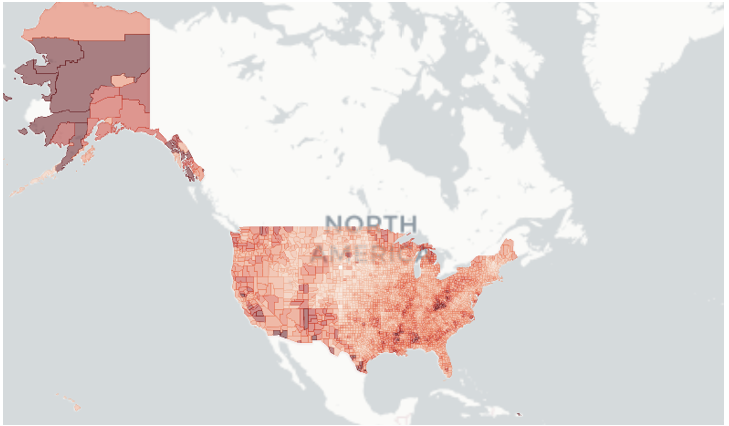
fig = go.Figure(go.Choroplethmapbox(geojson=counties, locations=df.fips, z=df.unemp,
colorscale="Reds", zmin=0, zmax=12,
marker_opacity=0.5, marker_line_width=0), layout=dict(mapbox_style="carto-positron",
mapbox_zoom=3, mapbox_center = {"lat": 37, "lon": -95}))
fig.show()
In the previous example, we use the geojson data and fips unemp datasets from the Plotly datasets repo.
We then use the go.Figure function and pass the properties of the Choroplethmapbox in the go.Choroplethmapbox() class.
Note that we pass the layout properties as a dictionary. The previous code should return a figure as shown:
Example 2
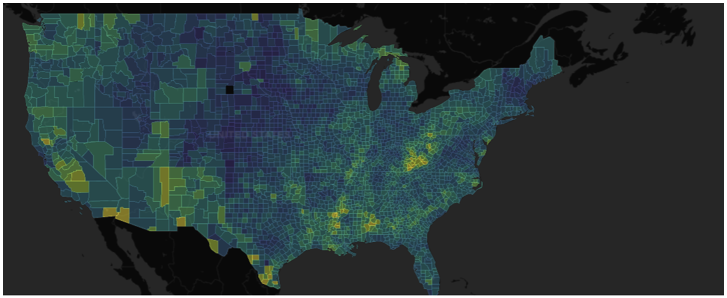
You can customize your plot layout using the update_layout() function. For example, to switch the Mapbox layout to an open street map, you can run the following code:
The previous code should add a dark background with the set colorscale. The resulting plot is shown below:
Feel free to reference the documentation to learn about Choroplethmapbox properties and how you can use them with graph_objects.
Conclusion
This article provides a tutorial on how to create Choroplethmapbox using Plotly’s graph objects. In addition, several essential parameters were discussed when using the Choroplethmapbox:
Source: linuxhint.com