How to Set the y-axis as a Log Scale in MATLAB
Plots are versatile tools mostly used in science and engineering for data visualization. Setting the y-axis as a long scale is useful in MATLAB for visualizing the data that varies over a wide range of values. The main reason is that the logarithmic scale compresses the data into smaller ranges and makes it easier for us to see the details.
In this blog, we will discover how to set the y-axis as a log scale in MATLAB.
How to Set the y-axis as a Log Scale in MATLAB
Sometimes MATLAB users need to scale the y-axis as a log scale keeping the x-axis as a linear scale while plotting a function or an expression. This can be obtained easily by using the semilogy() function.
The semilogy() function allows us to create two-dimensional plots of a function or expression with a logarithmic y-scale (base 10) in MATLAB. This type of plot is mostly used to plot very large and very small positive values. This function can also create the logarithmic plot for complex numbers by keeping the real components on the x-axis as well as the imaginary components on the y-axis.
Syntax
The semilogy() function has several syntaxes in MATLAB, which are given below:
semilogy(X,Y,LineSpec)
semilogy(Y)
semilogy(Y,LineSpec)
Here:
The function semilogy(X, Y) creates a logarithmic scale plot for the y-axis while keeping the x-axis as a linear scale.
- To plot a single set of data, X, as well as Y, should be the vectors having the same length.
- To plot multiple data sets, one of both X and Y should be a matrix.
The function semilogy(X, Y, LineSpec) creates the y-axis log scale plot using the line specifiers like marker size, color, and style.
The function semilogy(Y) creates a log scale y-axis corresponding to the implicit linear set of x-coordinate.
- If Y is a vector the number of x-coordinates lies between 1 and length(Y).
- If Y is a matrix, the count of x-coordinates contained between 1 and the count of rows of Y.
The function semilogy(Y, LineSpec) creates a log scale plot for Y using the line specifiers like marker size, color, and style.
Examples
Follow the given examples to learn how to use the semilogy() function in MATLAB to set up the y-axis as a log scale.
Example 1: How to Set a y-axis Plot Using Semilogy (X,Y) Function?
This MATLAB code creates a y-axis log scale plot corresponding to X and Y vectors using the semilog(X, Y) function.
clear;
X = 1:0.1:3;
Y = X.^5;
semilogy(X,Y)
grid on
In the above code, the X and Y axis are of the same length, so the semilogy() function will create a plot a with logarithmic scale on the y-axis and a linear scale on the x-axis.

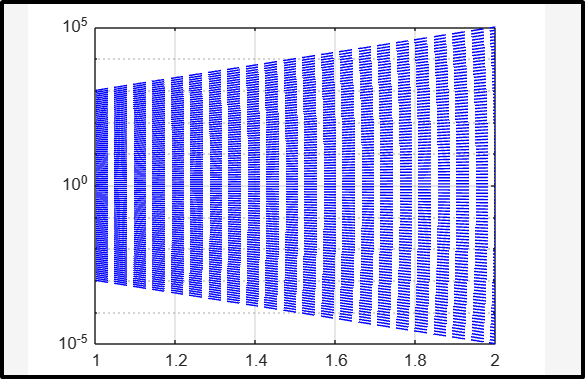
Example 2: How to Set a y-axis Plot Using semilogy(X,Y,LineSpec) Function?
The given example creates multiple log scale plots corresponding to the matrix Y using the semilogy(Y, LineSpec) function.
semilogy(Y, ‘–b’)
grid on
Example 3: How to Set a y-axis Plot Using semilogy(Y) Function?
In this example, we use the semilogy() function to create a log scale plot for the y-axis using the complex numbers stored in the vector Y.
semilogy(Y)
grid on

Conclusion
MATLAB is a beneficial tool for data visualization. It provides us with a semilogy() function that is used for creating the y-axis log scale plots keeping the x-axis as a linear scale. These plots are used for plotting the very large and very small positive values. These plots can also graph the logarithmic values of complex numbers by putting the real values on the x-axis as well as imaginary values on the y-axis. This guide has provided an easy way to create the y-axis log scale plots in MATLAB using the semilogy() function.
Source: linuxhint.com