How to Perform Aggregation Operation with Groupby() Mean
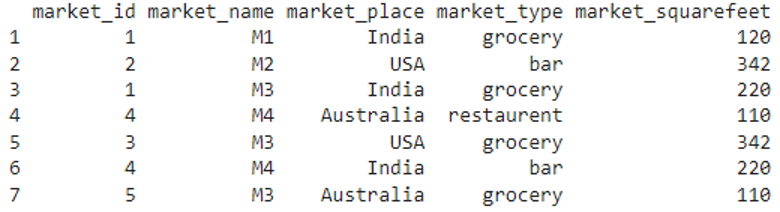
This operation has to be performed on a dataframe. Let’s create the dataframe with seven rows and five columns.
market=data.frame(market_id=c(1,2,1,4,3,4,5),market_name=c(‘M1’,‘M2’,‘M3’,
‘M4’,‘M3’,‘M4’,‘M3’),market_place=c(‘India’,‘USA’,‘India’,‘Australia’,‘USA’,
‘India’,‘Australia’),market_type=c(‘grocery’,‘bar’,‘grocery’,‘restaurent’,
‘grocery’,‘bar’,‘grocery’),market_squarefeet=c(120,342,220,110,342,220,110))
#display the market dataframe
print(market)
Result
Now, we return the average values of a column by grouping the similar values in another column.
Method 1: Aggregate()
Here, we use the aggregate() function that takes three parameters.
Syntax
Parameters
- The first parameter takes the variable column (grouped) which returns the mean values per group.
- The second parameter takes a single or multiple column (grouping) in a list such that the values are grouped in these columns.
- The third parameter takes FUN, which takes the mean function to return the average on the grouped values.
Example 1
In this example, we group the values in the market_place column and get the average values in the market_squarefeet column grouped by the market_place column.
market=data.frame(market_id=c(1,2,1,4,3,4,5),market_name=c(‘M1’,‘M2’,‘M3’,
‘M4’,‘M3’,‘M4’,‘M3’),market_place=c(‘India’,‘USA’,‘India’,‘Australia’,‘USA’,
‘India’,‘Australia’),market_type=c(‘grocery’,‘bar’,‘grocery’,‘restaurent’,
‘grocery’,‘bar’,‘grocery’),market_squarefeet=c(120,342,220,110,342,220,110))
#get the average of square feet in group by grouping market_place
print(aggregate(market$market_squarefeet, list(market$market_place), FUN=mean))
Result
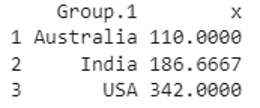
We can see that the similar values (Australia, India and USA) in the market_place column are grouped and returned the mean of the grouped values in the market_square feet column.
Example 2
In this example, we group the values in the market_type column and get the average values in the market_squarefeet column grouped by the market_type column.
market=data.frame(market_id=c(1,2,1,4,3,4,5),market_name=c(‘M1’,‘M2’,‘M3’,
‘M4’,‘M3’,‘M4’,‘M3’),market_place=c(‘India’,‘USA’,‘India’,‘Australia’,‘USA’,
‘India’,‘Australia’),market_type=c(‘grocery’,‘bar’,‘grocery’,‘restaurent’,
‘grocery’,‘bar’,‘grocery’),market_squarefeet=c(120,342,220,110,342,220,110))
#get the average of square feet in group by grouping market_type
print(aggregate(market$market_squarefeet, list(market$market_type), FUN=mean))
Result
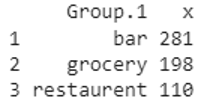
We can see that the similar values (bar, grocery, and restaurent) in the market_type column are grouped and returned the mean of the grouped values in the market_square feet column.
Example 3
In this example, we group the values in the market_type and market_place columns and get the average values in the market_squarefeet column grouped by the market_type and market_place columns.
market=data.frame(market_id=c(1,2,1,4,3,4,5),market_name=c(‘M1’,‘M2’,‘M3’,
‘M4’,‘M3’,‘M4’,‘M3’),market_place=c(‘India’,‘USA’,‘India’,‘Australia’,‘USA’,
‘India’,‘Australia’),market_type=c(‘grocery’,‘bar’,‘grocery’,‘restaurent’,
‘grocery’,‘bar’,‘grocery’),market_squarefeet=c(120,342,220,110,342,220,110))
#get the average of square feet in group by grouping market_place and market_type
print(aggregate(market$market_squarefeet, list(market$market_place,market$market_type), FUN=mean))
Result

We can see that the similar values from the two columns were grouped and returned the mean of the grouped values in the market_square feet column.
Method 2: Dplyr
Here, we use the group_by with summarise_at() which are available in the dplyr library to perform the group_by with the mean operation.
Syntax
Where:
group_by() takes one parameter, i.e. grouping column
summarise_at() takes two parameters:
- The first parameter takes the variable column (grouped) which returns the mean values per group.
- The second parameter takes the mean function through the list.
Finally, we first summarize with the mean and load into the group. Then, we load the grouped column into the dataframe object.
It returns a tibble.
Example 1
In this example, we group the values in the market_place column and get the average values in the market_squarefeet column grouped by the market_place column.
#get the average of square feet in group by grouping market_place
print(market %>% group_by(market_place) %>%
summarise_at(vars(market_squarefeet), list(name = mean)))
Result
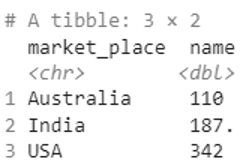
We can see that the similar values (Australia, India and USA) in the market_place column are grouped and returned the mean of the grouped values in the market_square feet column.
Example 2
In this example, we group the values in the market_type column and get the average values in the market_squarefeet column grouped by the market_type column.
#get the average of square feet in group by grouping market_type
print(market %>% group_by(market_type) %>%
summarise_at(vars(market_squarefeet), list(name = mean)))
Result
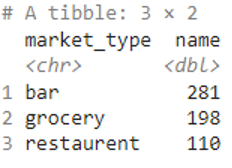
We can see that the similar values (bar, grocery, and restaurent) in the market_type column are grouped and returned the mean of the grouped values in the market_square feet column.
Conclusion
It is possible to group the single or multiple columns with other numeric columns to return the mean of the numeric column using the aggregate() function. Similarly, we can use the groupby() function with the summarise_at() function to group the similar values in a column and return the average of the grouped values with respect to another column.
Source: linuxhint.com