How to Create Discrete Plots in MATLAB
This article will teach you how to create discrete plots in MATLAB using different syntaxes and examples.
What is a Discrete Plot
A discrete plot is a type of plot that represents discrete data. Discrete data is a type of data that can only take a finite number of values, such as the number of oranges in a basket, employees in the office, and others.
Why Discrete Plot is Important
Discrete plots are one of the useful ways to get clear and concise information of discrete data on a plot. We can use these discrete plots to identify patterns and differentiate between the values of two or more discrete data plots or sets.
How to Create Discrete Plots in MATLAB?
We can easily create discrete plots in MATLAB using the built-in stem() function. This function accepts one or multiple discrete data series as input parameters and creates a discrete plot corresponding to the data values stored in the given data set.
Syntax
In MATLAB, you can use the stem() function in the following ways:
stem(X,Y)
Here:
The function stem(Y) is responsible for plotting the sequence Y of data as the stem extends from the baseline along the x-axis. The values of the data set are represented by the circle terminating each stem.
- If Y represents the vector, the scale of the x-axis will range from 1 to length(Y).
- If Y represents the matrix, this function will plot all values of each row against the same values of x and the scale of the x-axis will range from 1 to the number of rows in Y.
The function stem(X,Y) is responsible for plotting the data in the sequin Y against the values of X. Both inputs X and Y can be vectors or matrices having the same size, Furthermore, if x denotes a row or column vector, Y must be a matrix having the equal number of rows as the length of X.
- If X and Y both represent vectors, this function will plot all entries of Y against the corresponding entries of X.
- If X and Y both represent matrices, this function will plot each column of Y corresponding to each column of X.
- If X represents a vector and Y represents a matrix, this function will plot each column of Y corresponding to all values in X in such a way that elements in all rows of Y will plot against the same values.
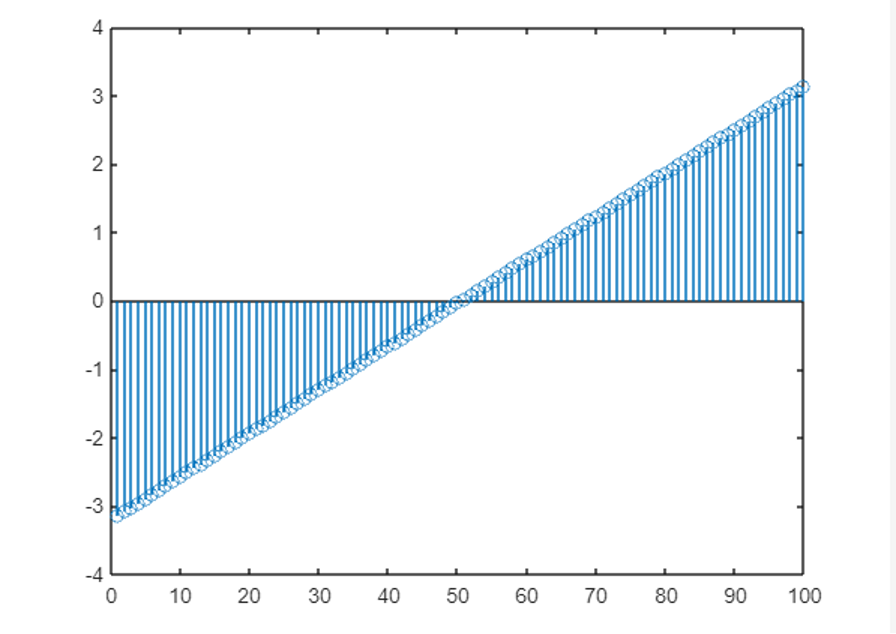
Example 1: How to Plot Single Data Series in MATLAB
This MATLAB code uses the stem() function to plot a vector Y having 100 elements.
Y = linspace(-pi,pi,100);
stem(Y)
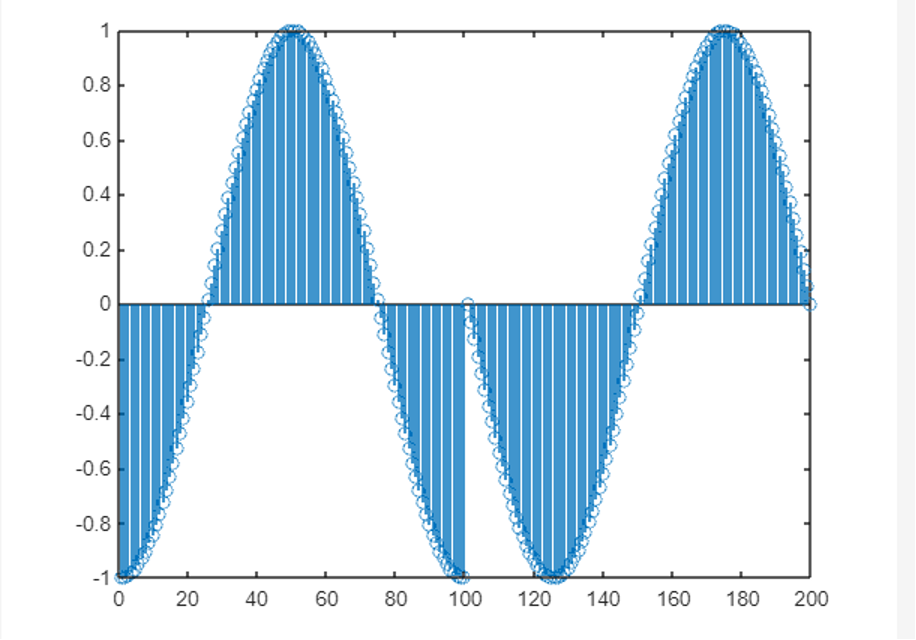
Example 2: How to Plot Multiple Data Series in MATLAB
In this example, we use the stem() function to plot multiple data series Y.
X = linspace(-pi,pi,100);
Y = [cos(X), sin(X)];
stem(Y)
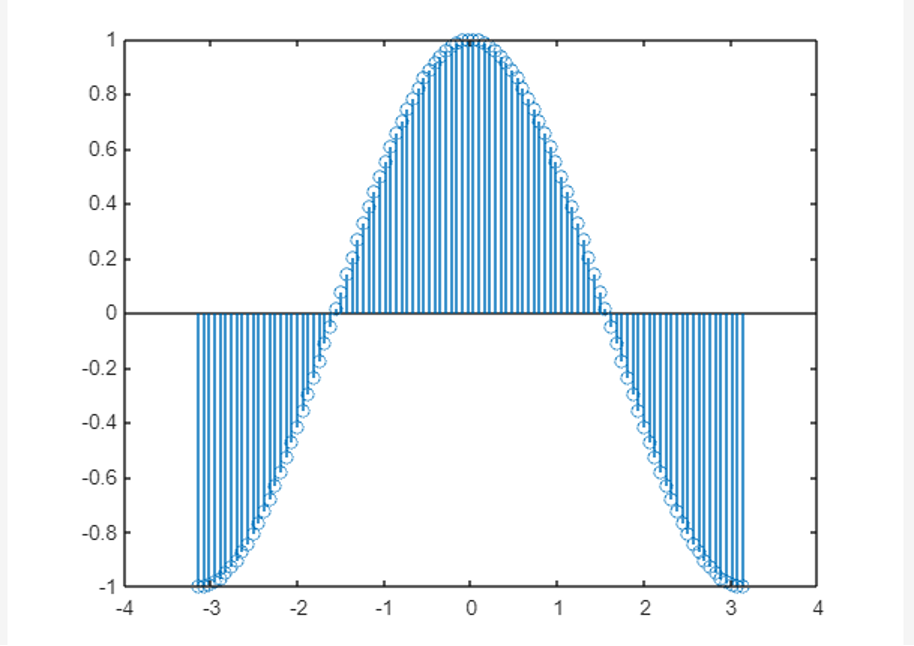
Example 3: How to Plot Single Data Series at Specific X Values in MATLAB
In this MATLAB code, we use the stem() function to plot single data series Y corresponding to the given values of X.
X = linspace(-pi,pi,100);
Y = cos(X);
stem(X,Y)
Conclusion
The discrete plots are useful for plotting discrete data points and these plots have applications in machine learning, data science, artificial intelligence, and other emerging fields. We can create discrete plots in MATLAB using the stem() function. This guide has provided details about the discrete plots, why they are useful and how to create these plots in MATLAB using the stem() function.
Source: linuxhint.com