Use of Matplotlib Tight_Layout in Python
The “Matplotlib” library is a popular Python library that creates various types of plots and charts. However, sometimes the plots may look crowded or comprise overlapping labels and titles. This can make them complex to read and interpret. To avoid this problem, the “matplotlib.pyplot.tight_layout()” function is used.
This tutorial explains a complete guide on using Matplotlib’s “Tight_Layout” in Python using appropriate examples.
What is the “matplotlib.pyplot.tight_layout()” Function in Python?
The “matplotlib.pyplot.tight_layout()” function is utilized to adjust the spacing and padding of the plots. It tries to minimize the white space around the plot elements and optimize the layout for better readability and aesthetics. It works by resizing and repositioning the axes of the plot figures based on their contents and labels.
Syntax
Parameters
The “matplotlib.pyplot.tight_layout()” function accepts the following parameters:
- The “pad” parameter specifies the amount of padding (in inches) between the figure edge and the edges of subplots. The default value is “08”.
- The “h_pad” and “w_pad” parameters indicate the amount of padding (in inches) between the edges of adjacent subplots. If “None”, they are set to “pad”.
- The “rect” parameter indicates a tuple of four values (left, right, top, bottom) that specifies the area of the figure to be adjusted. The values should be fractions of the figure’s width and height. The default value is (0, 0, 1, 1), meaning the entire figure.
Return Value
The “matplotlib.pyplot.tight_layout()” function does not return any value.
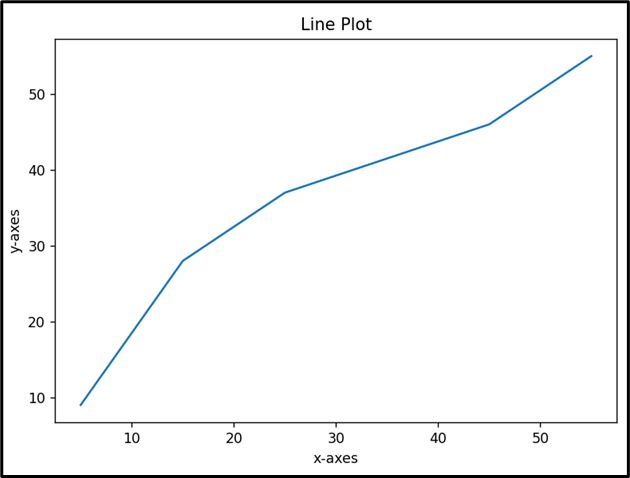
Example 1: Creating a Simple Plot With the “matplotlib.pyplot.tight_layout()” Function
The below code is used to produce a basic plot with the “matplotlib.pyplot.tight_layout()” function:
value_1 = [5, 15, 25, 45, 55]
value_2 = [9, 28, 37, 46, 55]
plt.plot(value_1, value_2)
plt.title('Line Plot')
plt.xlabel('x-axes')
plt.ylabel('y-axes')
plt.tight_layout()
plt.show()
In the above code:
- The “pyplot” module from “Matplotlib” is imported at the start.
- The “x” and “y” axes data for the plot are initialized as a list.
- The “plot()” function from the “pyplot” module is utilized to construct a line plot by connecting the points with straight lines.
- The “title()” function from the “pyplot” module specifies the plot title.
- The “xlabel()” and “ylabel()” functions are called to specify the labels of the x-axis and y-axis, respectively.
- The “pyplot.tight_layout()” function is applied to reduce the white space around the plot and make it more compact.
Output
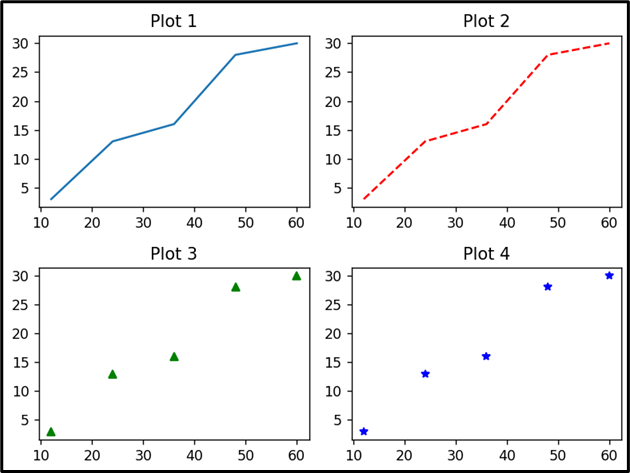
Example 2: Creating Multiple Subplots With the “matplotlib.pyplot.tight_layout()” Function
The given code is used to create multiple subplots using the discussed function:
x = [12, 24, 36, 48, 60]
y = [3, 13, 16, 28, 30]
# Create four subplots
plt.subplot(2, 2, 1)
plt.plot(x, y)
plt.title('Plot 1')plt.subplot(2, 2, 2)
plt.plot(x, y, 'r--')
plt.title('Plot 2')
plt.subplot(2, 2, 3)
plt.plot(x, y, 'g^')
plt.title('Plot 3')
plt.subplot(2, 2, 4)
plt.plot(x, y, 'b*')
plt.title('Plot 4')
plt.tight_layout()
plt.show()
In the above code snippet, the “matplotlib.pyplot.tight_layout()” function is applied to adjust the spacing and padding of the created four subplots, thereby making them more readable.
Output
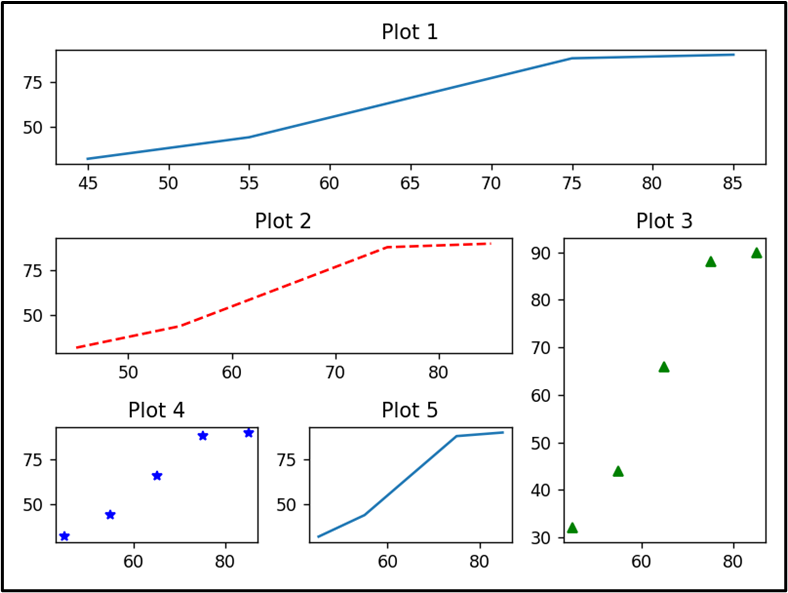
Example 3: Using “GridSpec” Layout With “matplotlib.pyplot.tight_layout()” Function
Let’s overview the following code:
import matplotlib.gridspec as gridspec
value_1 = [45, 55, 65, 75, 85]
value_2 = [32, 44, 66, 88, 90]
gs = gridspec.GridSpec(3, 3)
# Create six subplots with different sizes and positions
ax1 = plt.subplot(gs[0, :])
ax1.plot(value_1, value_2)
ax1.set_title('Plot 1')ax2 = plt.subplot(gs[1, :2])
ax2.plot(value_1, value_2, 'r--')
ax2.set_title('Plot 2')
ax3 = plt.subplot(gs[1:, -1])
ax3.plot(value_1, value_2, 'g^')
ax3.set_title('Plot 3')
ax4 = plt.subplot(gs[-1, 0])
ax4.plot(value_1, value_2, 'b*')
ax4.set_title('Plot 4')
ax5 = plt.subplot(gs[-1, -2])
ax5.plot(value_1, value_2)
ax5.set_title('Plot 5')
plt.tight_layout()
plt.show()
In the above code lines, the “matplotlib.pyplot.tight_layout()” function can also work well with the “GridSpec” layout and make it more organized and clear. “GridSpec” layout is a way of arranging multiple plots or panels in a grid using a simple API.
Output
Conclusion
This article explains how to use the “matplotlib.pyplot.tight_layout()” function in Python to automatically adjust the layout of your plots. This function can reduce the white space around the plot elements and optimize the layout so it is more readable and aesthetically pleasing. Furthermore, we discussed how to use the discussed function with “simple plots”, “subplots”, and “GridSpec” layouts.
Source: linuxhint.com