Syslog Tutorial
“Syslog is a way of consolidating logs from various systems to a remote Syslog server. The Syslog server has three key components. The first is a listener that utilizes UDP over port 514 to gather Syslog data. Next is the database that stores the generated Syslog data, and lastly, the management and filtering software that allows filtering the Syslog data for quick troubleshooting.
As a system administrator, understanding how Syslog works and how to configure client machines to channel their Syslog data to the remote server comes in handy. This guide discusses Syslog in Linux and offers steps for consolidating logs to a remote machine.”
Understanding Syslog
Syslog is a protocol that communicates using port 514 via UDP and allows hosts to transmit logs to Syslog servers over the IP networks. The work of the Syslog server is to monitor and respond to the Syslog notifications it receives.
Through this, an administrator can have central control of logs from various clients, such that they can quickly trace an error in a client’s machine and, based on the log message generated, troubleshoot it.
The Syslog clients generate Syslog messages that they send to the Syslog server. The message has three key parts.
- Priority – It represents the message’s severity and Facility. The priority value dictates the priority of the given log. Using it, you can filter the logs based on the priority value.
- Header – It represents the timestamp for the log and the name of the host/client machine sending the log message.
- Message – It represents the actual log message that an administrator will view when troubleshooting an error. The message includes details such as host IP addresses, severity, and the event message.
Let’s have an example of a Syslog message and identify its various parts.
In the above, we will start from the left. The 34 represents the priority value for the message. 2 is the version number for the log message. Next to it is the ISO timestamp, followed by the hostname. Next, we have the specific application that triggered the error and its PID. Lastly, we have the event’s message id and the log message.
Working With Syslog
Each system generates logs for events that cause an error, such as the random closing of an application. The logs for the local machine get stored in the /var/log, and you can list the contents to see the various
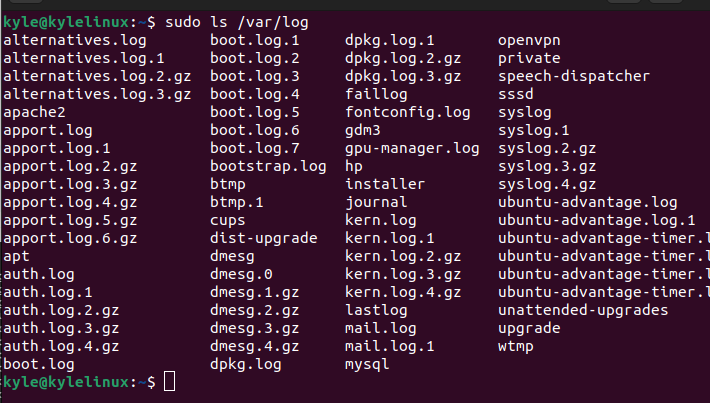
log files and directories for your system using the ls command.
You will note in the above image that we have the log file called syslog. It contains the logs for your system; in this case, it’s for Ubuntu/Debian systems. For RedHat, you may find messages instead of syslog.
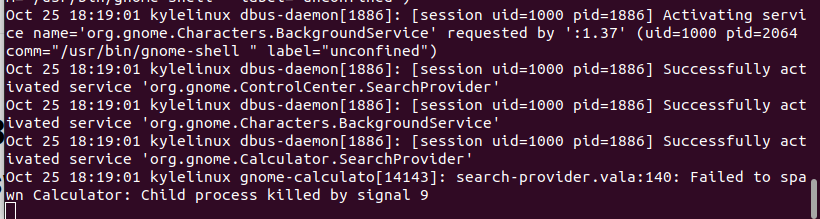
To view the logs for the system, open the log file in real-time using the tail command. For Debian/Ubuntu, use the command below.
For client machines, the rules for where to send the Syslog are contained in the rsyslog configuration file. You must edit this configuration file to set a machine to transmit its log files to a given Syslog server.
Working With rsyslog Configuration File
You can view this configuration file using an editor of choice. Let’s open it using the nano editor.
Below is how the configuration file looks.
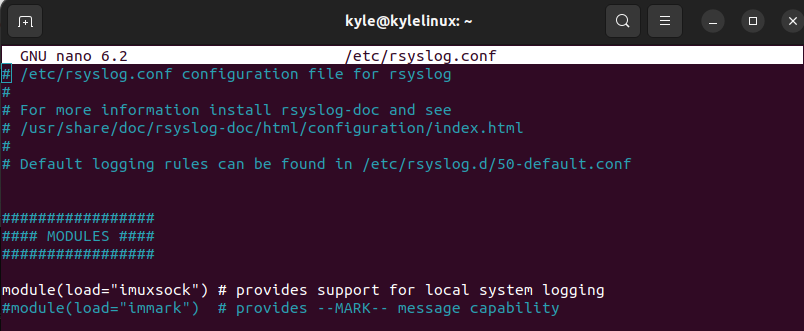
Any rules defined for your Syslog will be contained in this file, including the Syslog server and its IP address. Let’s create a Syslog server in a remote machine and transmit the logs from our client machine.
Configuring a Syslog Server
For this example, we are using Ubuntu 22.04 as our server.
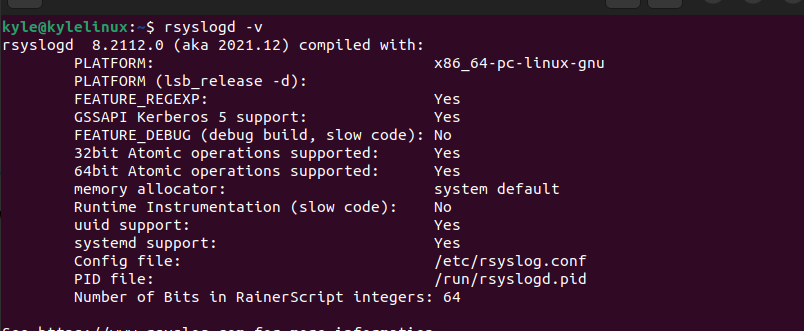
First, ensure you have the rsyslog installed by checking its version. If not installed, install it using apt.
The next thing is to open the rsyslog configuration file using the nano editor.
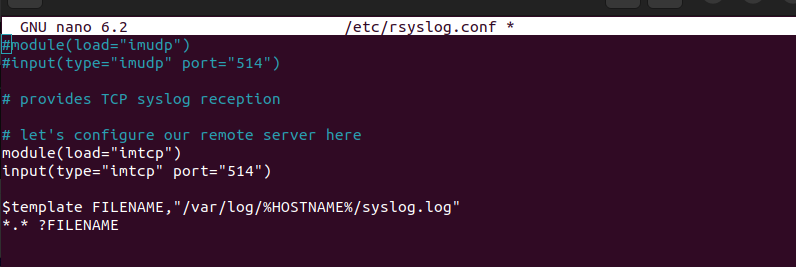
Locate the module and the input for TCP. Next, uncomment them by removing the # and adding the line below to have your configuration file appear like the one in the below image.
*.* ?FILENAME</td>
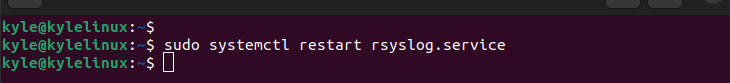
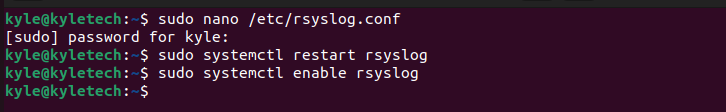
Once you’ve edited the configuration file, restart the rsyslog
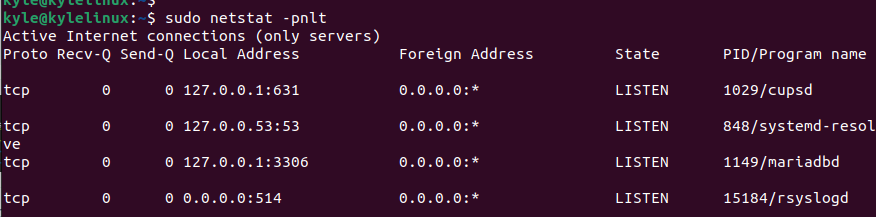
The last step is to verify that rsyslog is active and listening on UDP port 514. Use the below command to verify.
Configuring the Client
Open the client machine and verify it has rsyslog by checking the version.
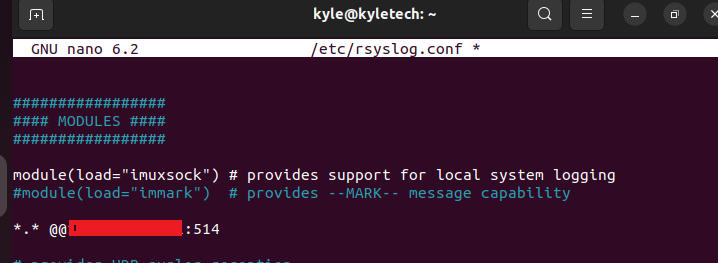
Next, open the rsyslog configuration file.
Once it opens, add your server’s IP address using the format below.
Restart and enable the rsyslog
$ sudo systemctl enable rsyslog
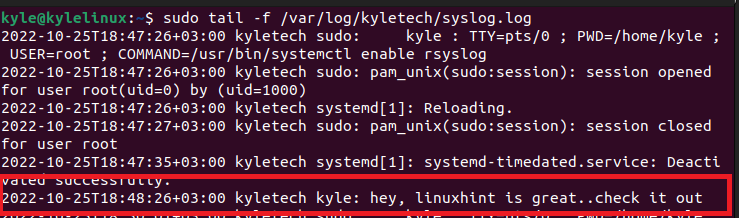
Let’s test the Syslog by logging a random message that should reflect on the client Syslog server.

Open the remote client and view the Syslog for the client in real-time. From the image below, we can see the logged message from the client confirming that our Syslog remote server is working.
Wrap Up
This guide has presented a hands-on tutorial on getting started with Syslog. We’ve seen how to read a Syslog message and configure a client-server architecture for Syslog. That’s it.
Source: linuxhint.com