Seaborn Tsplot
“Seaborn” is a Python library that is used for creating data visualizations. One of the most commonly used functions in Seaborn is “seaborn.lineplot()” function. This function replaced the “seaborn.tsplot()” function in version “0.12.01”. To create a plot in the latest version of the Seaborn library, the “seaborn.lineplot()” function is used in Python.
This post provides a detailed guide on the “seaborn.lineplot()” function with the help of the following covered content:
Note: The “seaborn.tsplot()” function has been deprecated since “version 0.11.0” and has been removed in “version 0.12.01”. It was used to plot time-series data with error bands. The “seaborn.lineplot()” function is used instead of the “seaborn.tsplot()” function, which is also capable of plotting time-series data accompanied by error bands.
What is “seaborn.lineplot()” Function in Python?
The “seaborn.lineplot()” function of the “Seaborn” library is used to plot a line chart. It takes in one or more variables and plots them against a continuous variable.
Syntax
Example 1: Using “seaborn.lineplot()” to Plot a Basic Line Plot
The below example code is used to plot a basic line plot using the “seaborn.lineplot()” function:
import matplotlib.pyplot as plt
data_set = seaborn.load_dataset("fmri")
seaborn.lineplot(x= "timepoint", y= "signal", data= data_set)
plt.show()
In the above code:
-
- Firstly, the modules named “seaborn” and “matplotlib” are imported.
- The “seaborn.load_dataset()” function is used to load a dataset called “fmri”. This dataset i.e., “fmri” is one of the examples of datasets that come with Seaborn.
- The “seaborn.lineplot()” function is used to create a line plot of the “fmri” dataset with the x-axis as “timepoint” and the y-axis as “signal”.
- Lastly, the “plt.show()” function is used to display the plot.
Output
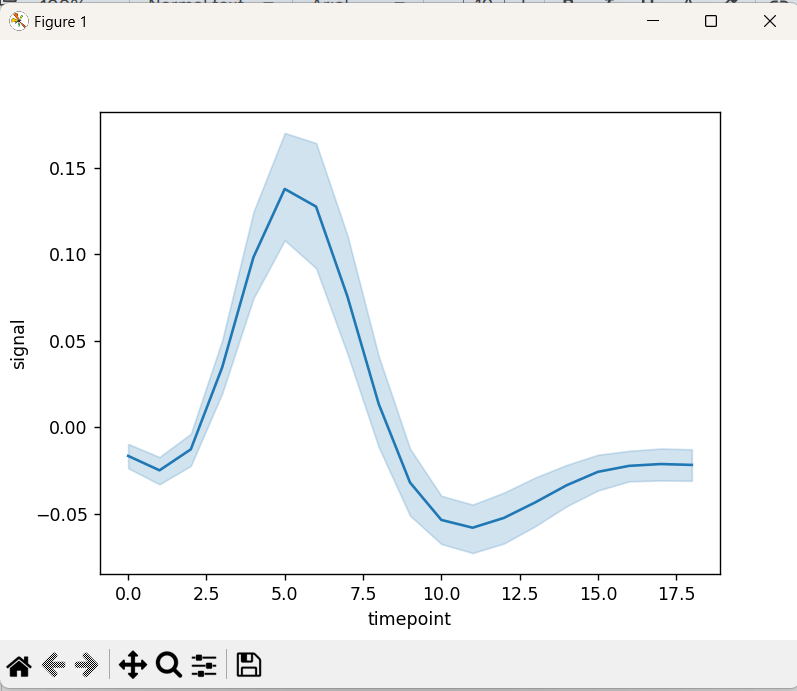
In the above output, the line plot of the specified dataset has been displayed appropriately.
Example 2: Using “seaborn.lineplot()” to Customize the Line Plot
The following example applies the discussed function to customize the previous plot by allocating some additional parameters(for modification) as follows:
import matplotlib.pyplot as plt
data_set = seaborn.load_dataset("fmri")
seaborn.lineplot(x="timepoint", y="signal", data=data_set, color='red', linestyle='--', markers=True, marker='o', markersize=10)
plt.show()
In the above code, apply the “seaborn.lineplot()” function comprising the parameters such as “color”, “linestyle”, and “markers”, etc. to customize the simple line plot created in the previous example.
Output
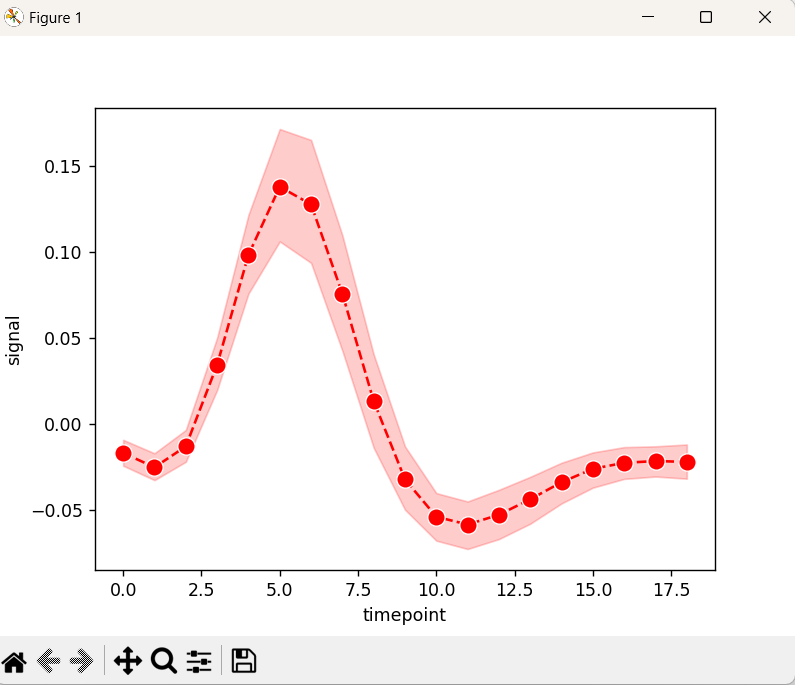
The line plot with a red dashed line, circular markers, and a marker size of “10” has been displayed in the above snippet in accordance with the customization.
Example 3: Using “seaborn.lineplot()” to Plot Multiple Lines in a Single Plot
We can also plot multiple lines in a single plot using the discussed function. Here is an example code:
import matplotlib.pyplot as plt
data_Set = seaborn.load_dataset("fmri")
seaborn.lineplot(x="timepoint", y="signal", hue="region", style="event", data=data_Set)
plt.show()
In the above code block:
-
- The “seaborn.load_dataset()” function is used to load a dataset named “fmri”.
- After that, the “seaborn.lineplot()” function creates a line plot by taking several parameters including “x”, “y”, “hue”, and “style”, respectively.
- The “hue” parameter specifies a column to use for grouping data by color, while the “style” parameter specifies a column to use for grouping data by line style.
Output
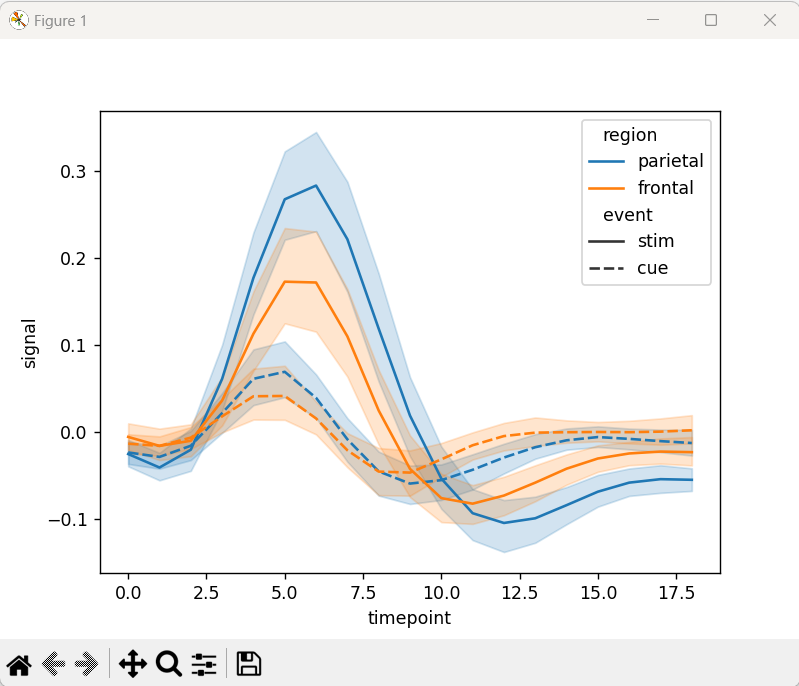
The above snippet shows that there are multiple lines plotted in a single plots graph.
Conclusion
The “seaborn.lineplot()” function is a powerful tool for visualizing the relationship between one or more variables and a continuous variable. It allows us to plot a basic line plot, customize it, or plot multiple lines in a single plot, etc. By utilizing different parameters available in the “seaborn.lineplot()” function, we can create insightful and informative line plots for our data analysis.
Source: linuxhint.com