Seaborn Subplots
The “seaborn” library delivers a powerful interface for creating graphically appealing and informative data visualizations. A useful feature of “seaborn” is the creation of “subplots“. Subplots allow you to display multiple plots in a single figure, which can be helpful when exploring relationships between different variables or comparing multiple groups.
In this article, we will explore how to create subplots in “seaborn” and provide examples to illustrate the different available options.
What are Subplots?
A “subplot” is a plot that is part of a larger figure. Subplots allow you to display multiple plots in a single figure, which can be helpful when exploring relationships between different variables or comparing multiple groups. The “seaborn” library provides several functions for creating subplots, including “FacetGrid” and “subplots”.
How to Create Seaborn Subplots in Python?
Creating “seaborn” subplots in Python is a straightforward process. Let’s create a “seaborn” plot using the following approaches:
Method 1: Creating Seaborn Subplots Using “plt.subplots()” Function
The “plt.subplots()” function in Python is utilized to create/make subplots and figures.
Syntax
Example
The below code uses the “seaborn” and “matplotlib” libraries to create the subplots in Python:
import matplotlib.pyplot as plt
tips = seaborn.load_dataset("tips")
fig, (ax1, ax2) = plt.subplots(ncols=2, figsize=(10, 4))
seaborn.histplot(tips["total_bill"], kde=False, ax=ax1)
ax1.set(title="Total Bill", xlabel="Total Bill", ylabel="Count")
seaborn.histplot(tips["tip"], kde=False, ax=ax2)
ax2.set(title="Tip", xlabel="Tip", ylabel="Count")
plt.suptitle("Total Bill and Tip")
plt.show()
In the above code:
- Firstly, the two libraries named “seaborn” and “matplotlib” are imported.
- The specified dataset called “tips” is loaded in the program using the seaborn “load_dataset()” function.
- The “plt.subplots()” function creates a figure with two subplots with two columns and a size of (10, 4).
- The seaborn “histplot()” function plots a histogram of the “total_bill” column of the “tips” dataset on the first subplot.
- It then plots a histogram of the “tip” column of the “tips” dataset on the second subplot using the seaborn “histplot()” function.
- The title of the figure is set using the “plt.suptitle()” function.
Output
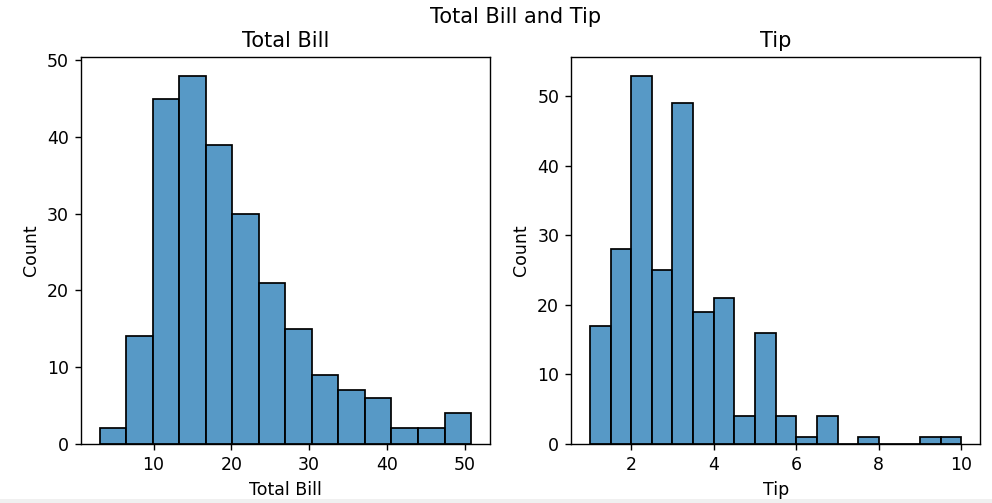
The above output verified that the seaborn subplot has been created.
Method 2: Creating Seaborn Subplots Using “seaborn.FacetGrid()” Function
The “FacetGrid()” function is utilized to draw plots that contain multiple “Axes” where individual “Axes” display the same relationship conditioned on various levels of some variable. The “seaborn.FacetGrid()” function creates a grid of subplots based on a dataset and a set of variables. Multivariate relationships can be visualized using it, as well as the distribution of one variable. This function is used along with the “map()” function to create subplots in Python.
Syntax
g.map(sns.scatterplot, "x_variable", "y_variable")
In this syntax:
- The “dataframe_name” is the name of the data frame or dataset that is used for plotting.
- The “row_variable” and “column_variable” are the names of the variables that you want to use for creating rows and columns respectively.
- Similarly, the “x_variable” and “y_variable” are the names of the variables that you want to plot on the “x-axis” and “y-axis”, respectively.
- The “sns.scatterplot” is the plotting function that you want to use for plotting your data.
Example
The following example is used to create a seaborn subplot using the “seaborn.FacetGrid()” function:
import matplotlib.pyplot as plt
tips = seaborn.load_dataset("tips")
plot = seaborn.FacetGrid(tips, col="time")
plot.map(seaborn.scatterplot, "total_bill", "tip")
plt.show()
In the above code block:
- The necessary libraries are imported at the start and the dataset is loaded using seaborn built-in function “load_dataset()”.
- The “FacetGrid()” function takes in the dataset and a column name “time” as its arguments to create a FacetGrid object.
- Finally, the “map()” function is applied which takes in the “scatterplot()” function and two column names “total_bill” and “tip” as its arguments. This creates a scatter plot of “total_bill” vs “tip” for each level of “time” such as “Lunch” and “Dinner” in the dataset.
Output
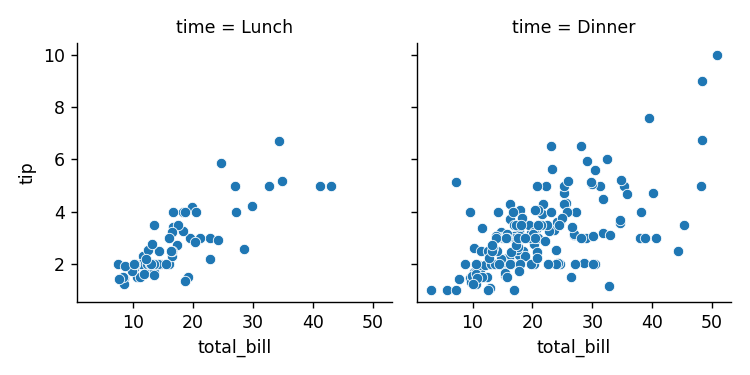
The subplot has been created in the above snippet appropriately.
Conclusion
To create a “seaborn” subplot in Python, various methods such as the “plt.subplots()” function and the “seaborn.FacetGrid()” function can be used. Creating seaborn subplots in Python is easy and can help you visualize multiple aspects of your data on a single page. The “seaborn.FacetGrid()” function is used along with the “map()” function and some plotting functions to create subplots in Python.
Source: linuxhint.com