Seaborn Rotate Axis Labels
In Python, the “matplotlib” and the “seaborn” libraries are utilized for the visualization of data. Users can draw multiple types of graphs by using the “matplotlib” library, such as scatter, bar, line, and many more. Likewise, the “seaborn” library offers various visualization patterns and specializes in statistics visualization.
This article will discuss about the seaborn rotate axis labels in Python.
How to Rotate Axis Labels Using “ticklabels()” Function in Seaborn Plot?
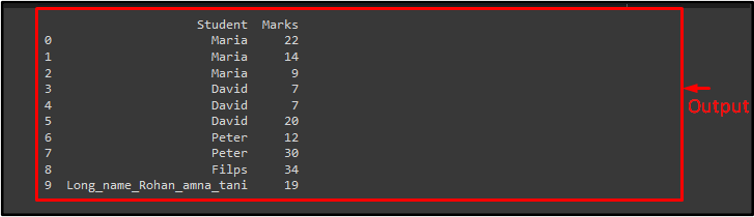
To rotate the axis labels of the seaborn plot by using the “ticklabels()” function, first, import the “pandas” library. Then, use the “DataFrame()” method to create a data frame according to desire and store it in the “df” variable. After that, apply the “print()” statement to view the generated data frame:
df = pd.DataFrame({'Student': ['Maria', 'Maria', 'Maria', 'David', 'David', 'David',
'Peter', 'Peter', 'Filps', 'Long_name_Rohan_amna_tani'],
'Marks': [22, 14, 9, 7, 7, 20, 12, 30, 34, 19]})
print(df)
It can be observed that the data frame has been created successfully:
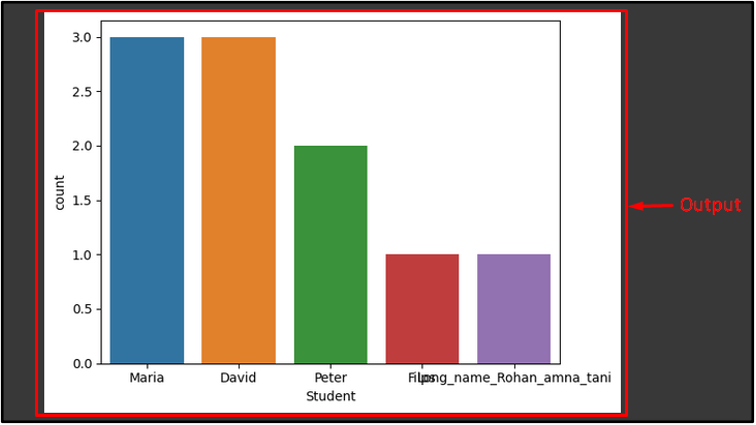
Now, import the “seaborn” library and call the “countplot()” method that takes two parameters, such as data that holds the data frame and the column name as a second variable:
plot = sns.countplot(data=df, x='Student')
In the provided output, the graph has been plotted successfully with normal labels positions:
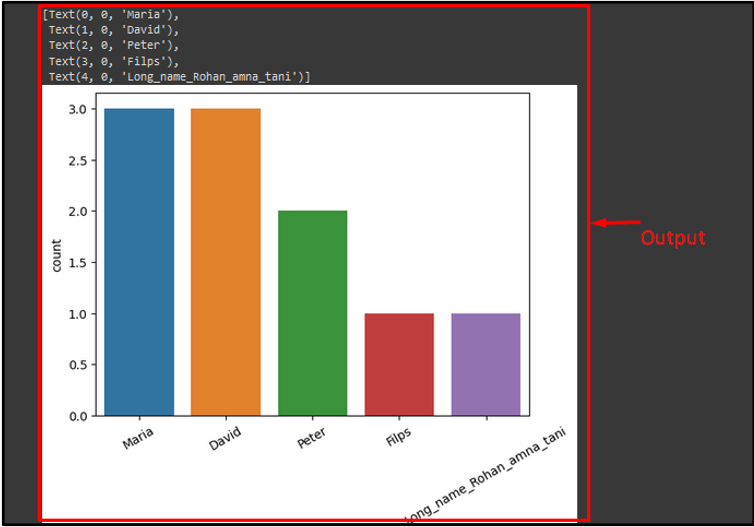
Next, apply the “ticklabels()” method that takes two parameters, such as the name of the desired section and the “rotation” parameter that holds the rotation angle/value. For instance, we want to rotate the x-axis labels to 30:
According to the provided output, the x-axis labels are rotated successfully:
You have learned the easiest method to rotate the seaborn plot axis labels position in Python.
Conclusion
To rotate the seaborn plot axis labels position, the “ticklabels()” method can be used in Python. The seaborn provides a lot of figure customization and the “ticklabels()” method as tick labels on both axes is one of them. This article described the procedure to rotate the seaborn plot axis labels position in Python.
Source: linuxhint.com