Seaborn Lineplot
“Seaborn” is used as a library for data visualizations to predict the outcome and analyze variations in the dataset. “Line Plots” are data visualizations that show how one continuous variable changes with another. To create simple and elegant continuous line plots, the “seaborn.lineplot()” function is used in Python.
This blog explains a detailed guide on Python seaborn “lineplot” via the below content:
- What is the “seaborn.lineplot()” Function in Python?
- Applying “seaborn.lineplot()” Function to a Create Single Seaborn Lineplot.
- Applying “seaborn.lineplot()” Function to Create Multiple Seaborn Lineplot.
- Applying “seaborn.lineplot()” Function to Customize Seaborn Line Plot Using Various Parameters.
What is the “seaborn.lineplot()” Function in Python?
The “seaborn.lineplot()” function of the “seaborn” module is used to plot connected lines across the data points. To create a lineplot, we must provide values for the x and y-axes.
Syntax
You can check this documentation for a complete syntax with all the parameter values.
Parameters
In the above syntax:
- The “x” and “y” parameters specify the data variable for the x-axis and y-axis.
- The “data” parameter specifies the object pointing to the entire data set.
Return Value
The “seaborn.lineplot()” function retrieves the matplotlib axes with plotted points.
Example 1: Applying the “seaborn.lineplot()” Function to Create a Single Seaborn Lineplot
The below code is used to create a single seaborn lineplot:
import seaborn
import matplotlib.pyplot as plt
X1 = [150, 250, 350, 440, 220]
Y1 = [130, 185, 174, 265, 299]
data_plot = pandas.DataFrame({"Total Marks":X1, "Obtained Marks":Y1})
seaborn.lineplot(x = "Total Marks", y = "Obtained Marks", data=data_plot)
plt.show()
In the above code:
- The “pandas”, “seaborn”, and “pyplot” modules are imported.
- The “pd.DataFrame()” function accepts the “x-axis” and “y-axis” data and creates a pandas DataFrame.
- The “seaborn.lineplot()” function takes the x-axis, y-axis and data set as its arguments, respectively to create the line plot.
Output
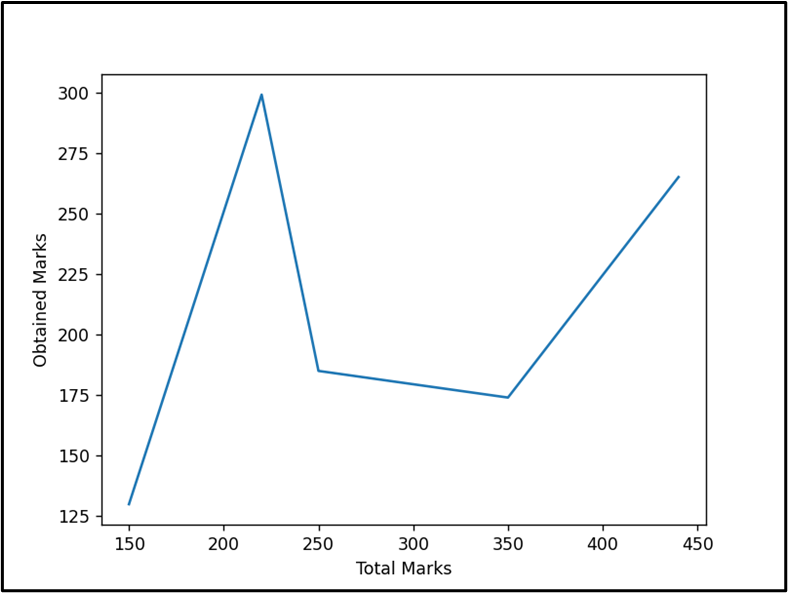
The single line plot has been created.
Example 2: Applying the “seaborn.lineplot()” Function to Create Multiple Seaborn Line Plots
The “hue” parameter is used to show how the “x” and “y” axes data columns are related to another variable in the dataset. This will assign different colors to the data points based on the chosen variable, making it easier to compare and contrast them. The given code creates multiple seaborn line plots:
import matplotlib.pyplot as plt
data = seaborn.load_dataset("tips")
seaborn.lineplot(x="total_bill", y="tip", hue="day", data=data)
plt.show()
In the above code:
- The “seaborn” and “matplotlib” modules are imported.
- The “seaborn.load_dataset()” function takes the pre-defined seaborn dataset “tips” and assigns it to the “data” variable.
- The “seaborn.lineplot()” function takes the x-axis, y-axis, and data set along with the “hue” value as its arguments and plots the multiple line plot.
Output
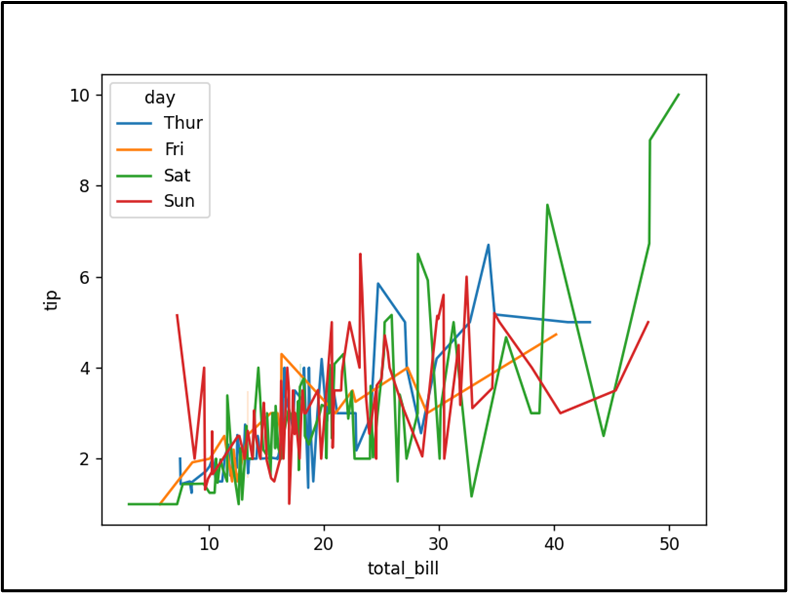
The multiple-line plot has been created accordingly.
Example 3: Applying the “seaborn.lineplot()” Function to Customize Seaborn Line Plot Using Various Parameters
The following code is used to customize the seaborn lineplot:
import seaborn
import matplotlib.pyplot as plt
X1 = [150, 250, 350, 440, 220]
Y1 = [130, 185, 174, 265, 299]
data_plot = pandas.DataFrame({"Total Marks":X1, "Obtained Marks":Y1})
seaborn.lineplot(x = "Total Marks", y = "Obtained Marks", data=data_plot, linestyle='dotted', color='magenta', linewidth=5)
plt.show()
In the above code lines, the “linestyle”, “color”, and “linewidth” parameters are used to customize the seaborn lineplot.
Note: The “seaborn.lineplot()” function attributes, such as figsize, title, xlabel, ylabel, font_scale, marker, and others, are used to adjust the figure size, title, labels, font size, etc., in the Seaborn line plot.
Output
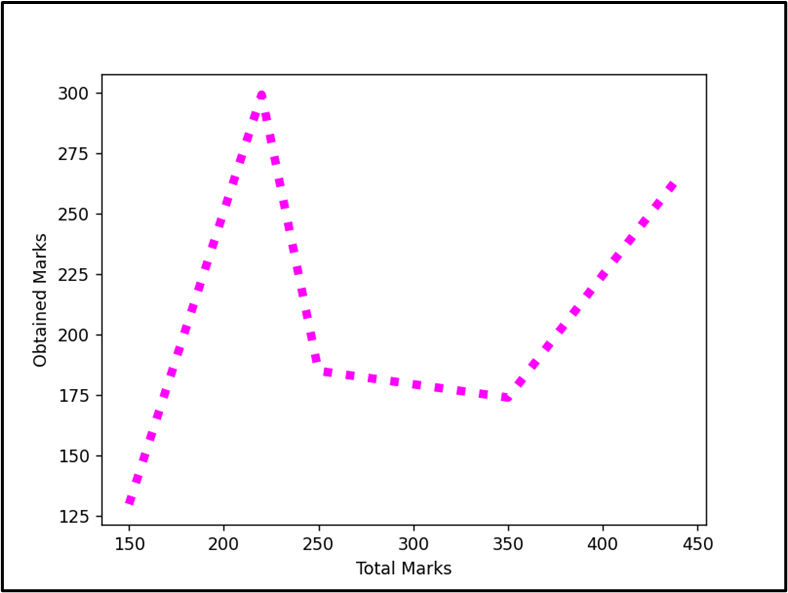
The seaborn plot has been customized successfully.
Conclusion
In Python, the “seaborn.lineplot()” function of the “seaborn” module is used to plot single or multiple continuous line plots. The “hue” parameter plots the multiple line plots based on various data point values. Similarly, the other parameters, such as figsize, title, xlabel, ylabel, etc. are used to customize the line plot. This write-up presented an in-depth guide on Python seaborn “Line Plot” using appropriate examples.
Source: linuxhint.com