Seaborn Legend
Data visualization is essential in conveying information effectively. When creating visual representations of data using “Seaborn”, one essential element to consider is the “legend”. The “legend” is a visual guide that explains the meaning of different elements in a plot. It provides key information about the plotted data, thereby helping viewers to understand the relationships and patterns within the visualization.
This article explores a comprehensive guide on the “Seaborn Legend” using numerous examples.
How to Add a Basic Legend in Seaborn?
A “legend” is automatically added to seaborn graphs by default and to add/create a legend to a “seaborn” plot, the “legend()” function of the “matplotlib” library is used in Python. This function takes several parameters such as “loc”, “title”, “labels” and “handles”.
Example
The following code is used to add/insert a legend to the plot:
import matplotlib.pyplot as plt
data = seaborn.load_dataset('tips')
seaborn.scatterplot(data=data, x='total_bill', y='tip', hue='day')
plt.legend(loc='upper left', title='Day of Week', fontsize=12)
plt.show()
In the above code:
- The “seaborn” and “matplotlib” libraries are imported at the start of the program, respectively.
- The “load_dataset()” method is used to load the pre-defined dataset “tips” and assign it to a variable named “data”.
- The “scatterplot()” method is used to plot the scatter plot by taking the dataset and other parameters.
- The matplotlib function “legend()” is used to add the legend with the stated title and font size to the upper left corner of the graph.
Output
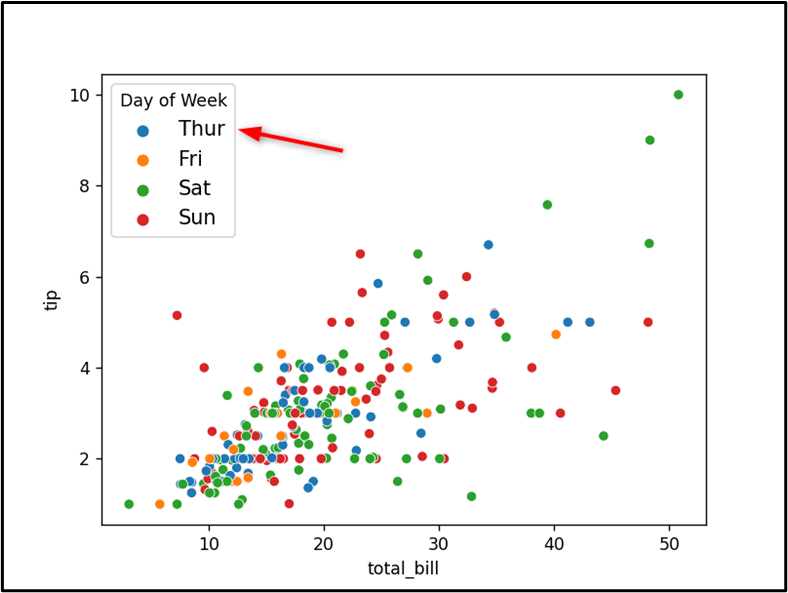
The legend has been added to the seaborn plot appropriately.
How to Customize the Seaborn Legend?
To customize the seaborn “legend”, various parameters of the “legend()” function are used in Python.
Example: Changing the Location of a Seaborn Legend
The legend “location” can be changed/updated by using the “loc” parameter of the “legend()” function. This parameter/argument can be a “string/str” or an “integer/int”. For a detailed understanding, you can check this specific guide. The below example code is utilized to update the “location” of the seaborn “legend”:
import matplotlib.pyplot as plt
data = seaborn.load_dataset('tips')
seaborn.scatterplot(data=data, x='total_bill', y='tip', hue='day')
plt.legend(loc='upper center', title='Day of Week', fontsize=12)
plt.show()
In the above code, the assigned “loc= ‘upper center’” parameter is used to change the location of the seaborn legend and place it at the upper center of the plot.
Output
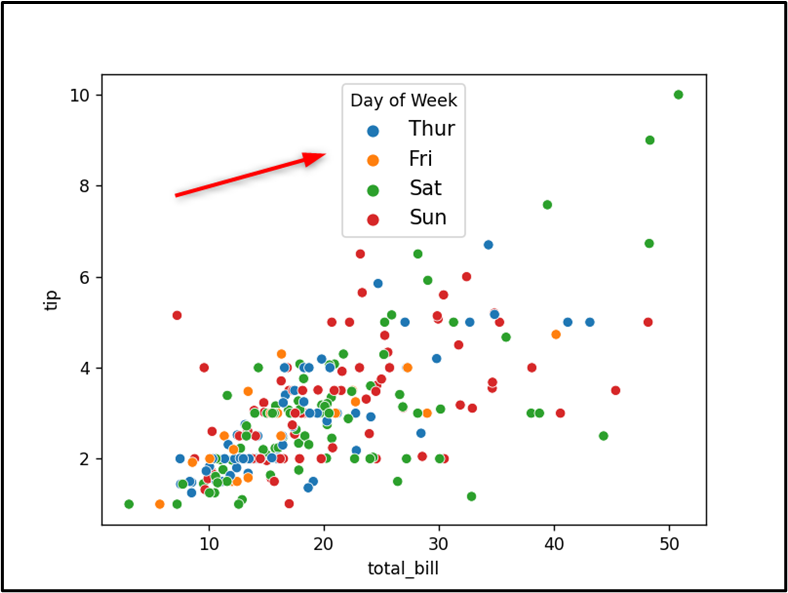
In this outcome, the location of the legend has been changed successfully using the “loc” parameter.
Note: The size, font, color, and title of the legend can also be changed by using the “fontsize”, “fontname”, “color” and “title” parameters of the “legend()” function, respectively.
Conclusion
A “legend” is automatically added to seaborn graphs by default and to add it manually, apply the “plt.legend()” function in Python. To customize a legend based on its location, the “size”, “font”, “color”, “title”, etc. parameters of the “plt.legend()” function can be used. This guide presented various ways to add a legend to the seaborn plot.
Source: linuxhint.com