Seaborn Legend Location
The Seaborn library is utilized for creating graphics on the top of the “matplotlib” along with the data structure of the “pandas”. Additionally, by utilizing this package, users are allowed to change/modify the properties including the color, size, location, background, and many more. To change the location of the legends, the “plt.legend()” method can be used by passing the “loc= ‘value’” parameter. Seaborn legends is basically a dialog box that is located in the graph/chart. It has the multiple attributes description along with the graph of desired colors.
This article with talk about:
How to Create a Dataset Using the “DataFrame()” Method in Python?
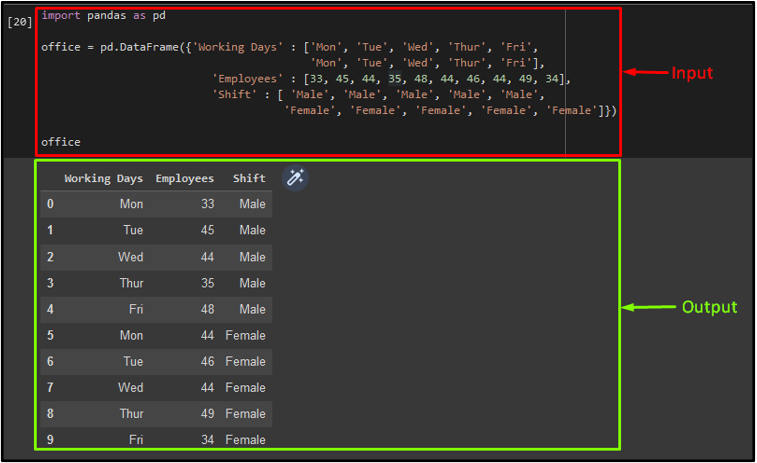
To generate a new dataset by using the “DataFrame()” method, first, import the “pandas” library:
Now, apply the “DataFrame()“ method to create a dataset by providing values and store them in the “office” variable. Then, display the dataset:
'Mon', 'Tue', 'Wed', 'Thur', 'Fri'],
'Employees' : [33, 45, 44, 35, 48, 44, 46, 44, 49, 34],
'Shift' : [ 'Male', 'Male', 'Male', 'Male', 'Male',
'Female', 'Female', 'Female', 'Female', 'Female']})
office
As you can see, we have successfully created a dataset:
How to Create a Seaborn Bar Chart and Adjust the Legend Location in Python?
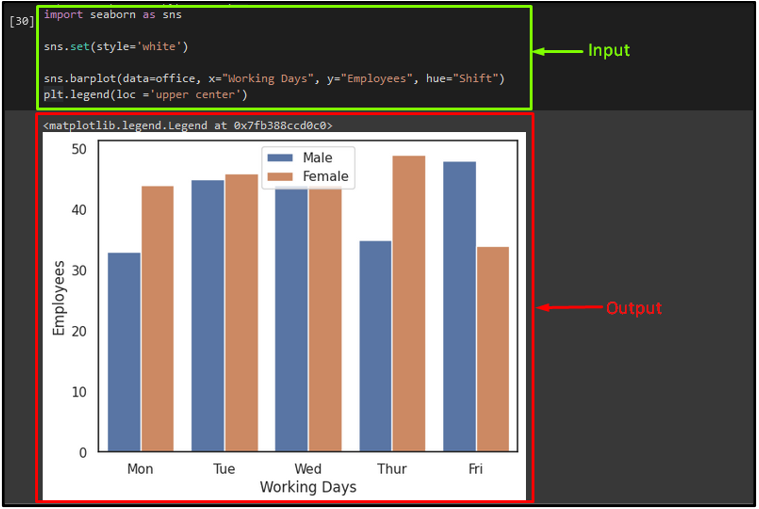
Now, to create the seaborn bar chart of the previously created dataset, import the required libraries, such as “matplotlib.pyplot” and “seaborn” Python’s libraries:
import seaborn as sns
Next, use the “sns.set()” method and pass the “style” parameter with its values to set the background color of the seaborn bar chart. Then, apply the “sns.barplot()” method and add the “data”, “x-axis”, “y-axis”, and “hue” parameters along with their values. After that, call the “plt.legend” method with the “loc” argument to adjust the location of the legend on the desired point inside the bar chart. For instance, we have set it into the “upper center” side. You can specify your desired location:
sns.barplot(data=office, x="Working Days", y="Employees", hue="Shift")
plt.legend(loc ='upper center')
It can be seen that the legend location has been successfully adjusted inside the bar chart:
You can also set the legend location outside of the bar chart by using the “bbox_to_anchor” parameter that enables the users to specify an “x” and “y” pair with the offset for moving the seaborn legends. Here, we have specified the “1, 1” as the axes:
Output

We have briefly discussed the seaborn legend location in Python.
Conclusion
To adjust the seaborn legend location in Python, the “plt.legend()” method can be used along with the “loc= ‘value’” parameter. The legend is a dialog box that is located in the graph/chart. This article illustrated the way to set the location of the seaborn legend in Python.
Source: linuxhint.com