Seaborn Heatmap Size
To represent the data in a statistical graphical form, the “seaborn” Python package can be used that is built on the “matplotlib” library. It offers multiple features, and the “heatmap” is one of them that uses a color palette to depict variations in linked data. In the Seaborn module, the “sns.heatmap()” method is used for making heatmap charts.
This post will cover:
- What is Seaborn Heatmap Size in Python?
- Example 1: How to Set the Size of Seaborn Heatmap using the “set()” Function in Python?
- Example 2: How to Set the Size of Seaborn Heatmap using the “figure()” Function in Python?
- Example 3: How to Set the Size of Seaborn Heatmap using the “gcf()” Function in Python?
What is Seaborn Heatmap Size in Python?
In Python, the seaborn heatmap size is utilized for the graphical representation of the matrix. It plots the graph matrix and uses the different shades of color for different types of values.
Let’s have a look at the provided examples for a better understanding!
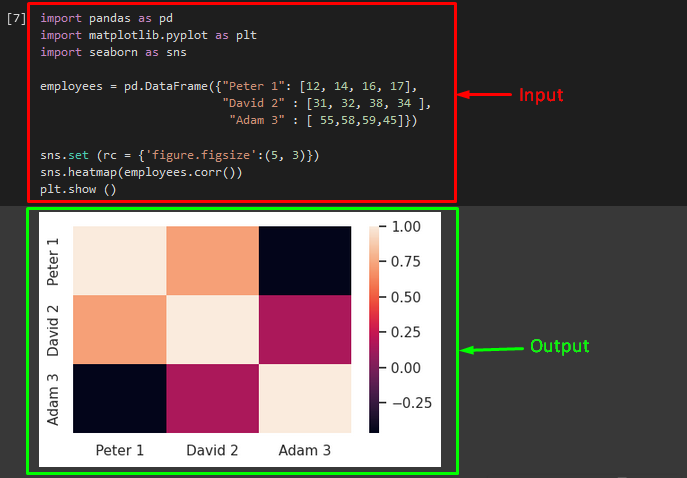
Example 1: How to Set the Size of Seaborn Heatmap Using the “plt.set()” Function in Python?
To set the size of the heatmap, the “plt.set()” method can be used along with the “rc” parameter and its value. To do so, first, import the Python’s required libraries, such as “matplotlib”, “pandas”, and “seaborn” libraries:
import matplotlib.pyplot as plt
import seaborn as sns
Then, use the “DataFrame()” method to create a new data frame named “employees” and add the values:
"David 2" : [31, 32, 38, 34 ],
"Adam 3" : [ 55,58,59,45]})
Now, call the “set()” method to adjust the size of the plot and pass the “rc” parameter along with its values according to your desire. After that, apply the “sns.heatmap()” function and use the “corr()” method to retrieve the correlation of each column in a specified data frame. Lastly, to display the resultant plot, use the “show()” method:
sns.heatmap(employees.corr())
plt.show()
Output
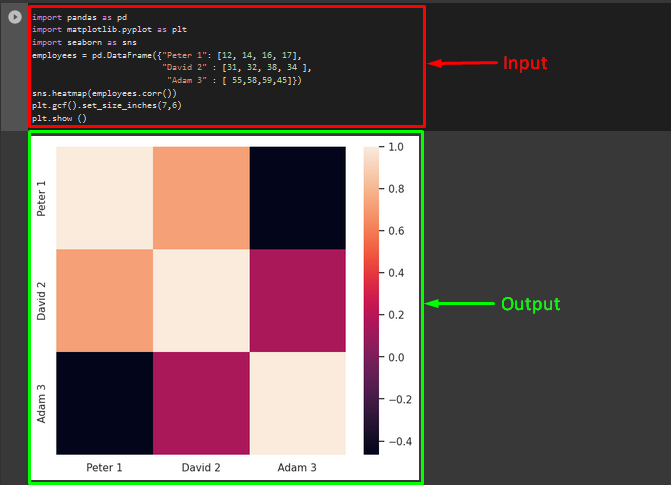
Example 2: How to Set the Size of Seaborn Heatmap Using the “plt.figure()” Function in Python?
The “plt.figure()” function can be used to set the size of the seaborn heatmap. To do so, apply the “plt.figure()” method and pass the “figsize” parameter with the x-axis and y-axis sizes. Then, call the “sns.heatmap()” function and pass the data frame name as an argument along with the “corr()” method. To show the updated plot, invoke the “plt.show()” method:
sns.heatmap(employees.corr())
plt.show()
As you can see, the size of the seaborn heatmap has been increased successfully:

Example 3: How to Set the Size of Seaborn Heatmap Using the “plt.gcf()” Function in Python?
The “plt.gcf()” function is primarily utilized for getting the current figure. If it is used along with the “set_size_inches()” method, then it will resize the seaborn heatmap. For that particular purpose, apply the “plt.gcf().set_size_inches()” method with the height and width values. For visualization, call the “plt.show()” method:
plt.show()
That’s all! We have provided the details about the seaborn heatmap size in Python.
Conclusion
To resize the Seaborn heatmap in Python, the “plt.set()”, “plt.figure()”, and “plt.gcf” methods are used. The “plt.set()” method can be used along with the “rc” parameter and its value. The “plt.figure()” method takes the “figsize” parameter with the x-axis and y-axis sizes. The “plt.gcf()” method is used with the “set_size_inches()” method to set the height and width of the seaborn heatmap. This article illustrated the ways to resize the seaborn heatmap in Python.
Source: linuxhint.com