Seaborn HeatMap Colors
The “Heatmap” is a chart type that utilizes various shades of colors to illustrate data values. Python supports different libraries, such as Matplotlib or Seaborn, to deal with data visualization and create various types of plots. The “seaborn.heatmap()” of the “Seaborn” module is used to create a heatmap and plots the data as a colored matrix.
This tutorial presents an in-depth guide on the “seaborn.heatmap()” function using the below-provided content:
- What is the “seaborn.heatmap()” in Python?
- Implementing a Sequential Colormap on a Seaborn Heatmap
- Implementing a Sequential Colormap on a Seaborn HeatMap Using cmap Parameter Value
- Setting Colorbar Max and Min for Seaborn heatmap
- Implementing a Diverging Colormap on a Seaborn HeatMap
What is the “seaborn.heatmap()” in Python?
The “seaborn.heatmap()” function is utilized in Python to plot/create rectangular data in the color-coded matrix form. The “seaborn.heatmap()” function is shown below:
In the above syntax:
- The “data” parameter is compulsory and must be a 2-dimensional array or DataFrame.
- The “vmin” and “vmax” parameters specify the minimum and maximum data values. If this is not specified, the “Seaborn” module will automatically determine these values.
- The “cmap” parameter specifies the “colormap” to use. If not specified, then the default colormap is used.
- The “center” parameter specifies the center value of the colormap. If not specified, the mean of the data is used.
- The other parameters are optional and also perform certain operations.
Let’s understand this method via the below examples:
Example 1: Implementing a Sequential Colormap on a Seaborn Heatmap
Let’s overview the given below code example:
import matplotlib.pyplot
import numpy
numpy.random.seed(0)
data = numpy.random.rand(8, 8)
colormap = seaborn.color_palette("Blues")
seaborn.heatmap(data, cmap=colormap)
matplotlib.pyplot.show()
In the above code:
- The “seaborn”, “matplotlib” and “numpy” module is imported.
- The “numpy.random.seed()” is used to set the random seed to “0”. It guarantees that the same/identical random numbers are created each time the program code is executed.
- The “numpy.random.rand()” function is used to create a 2D array of random numbers with dimensions “8” x “8”.
- The “seaborn.color_palette()” is used to create the colormap using the “Blues” palette from the “Seaborn”.
- Lastly, the “seaborn.heatmap()” takes the data and “cmap” as arguments to create the heatmap.
Output
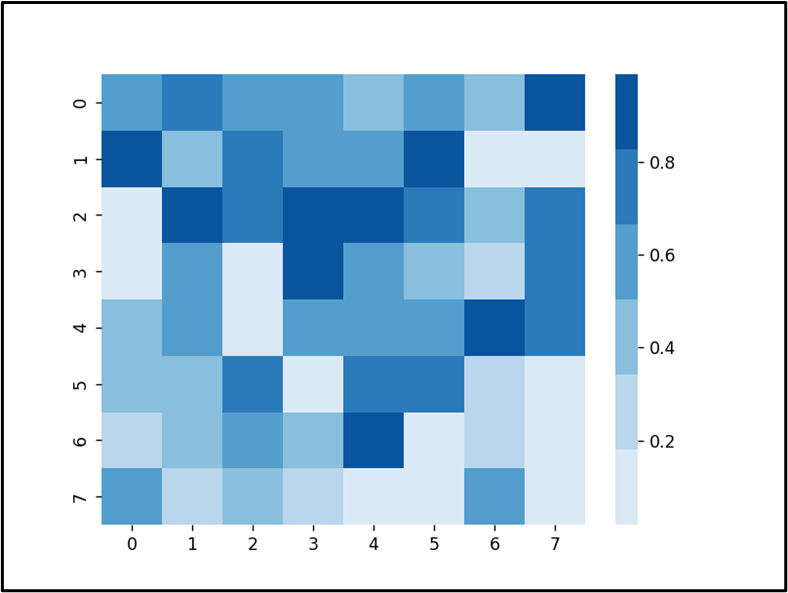
The heatmap of the random number with colors based on the “Blues” colormap has been created.
Example 2: Implementing a Sequential Colormap on a Seaborn HeatMap Using cmap Parameter
We can use the “cmap” argument to pass the inbuilt Seaborn colormap directly to the “seaborn.heatmap()” function. For instance, look at the following code:
import matplotlib.pyplot
import numpy
numpy.random.seed(0)
data = numpy.random.rand(8, 8)
seaborn.heatmap(data, cmap="Blues")
matplotlib.pyplot.show()
In the above code:
- The “cmap= Blues” is passed directly to the “seaborn.heatmap()” function to apply a sequential colormap on a heatmap.
Output

A random number heatmap in Blues “colormap” has been created successfully.
Example 3: Setting Colorbar Max and Min for Seaborn heatmap
The below code is used to set the max and min value of the color bar on a Seaborn heatmap:
import matplotlib.pyplot
import numpy
numpy.random.seed(0)
data = numpy.random.rand(8, 8)
seaborn.heatmap(data, cmap="Blues", vmin=0.2, vmax=0.5)
matplotlib.pyplot.show()
Here in this code:
- The “vmin” and the “vmax” parameter is used to set the maximum and minimum value for the color bar on a Seaborn heatmap.
- These parameter values are passed to the “seaborn.heatmap()” function to create a heatmap with colormap.
Output
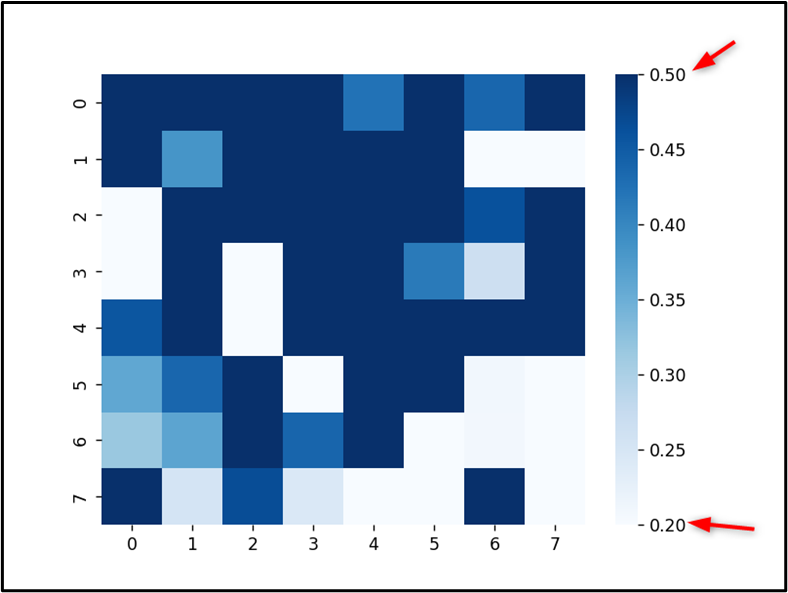
The minimum and maximum value of the colorbar of the heatmap has been customized successfully.
Example 4: Implementing a Diverging Colormap on HeatMap
We can implement the diverging colormap on a Seaborn heatmap to represent high to low and both high or low values of interest. Let’s understand this by the below code:
import matplotlib.pyplot
import numpy
numpy.random.seed(0)
data = numpy.random.rand(8, 8)
seaborn.heatmap(data, cmap="coolwarm")
matplotlib.pyplot.show()
In the above code:
- The “seaborn.heatmap()” function takes the “cmap” as an argument and implements a diverging colormap on a seaborn heatmap.
- The “cmap” is assigned with the default color scheme “coolwarm”.
Output
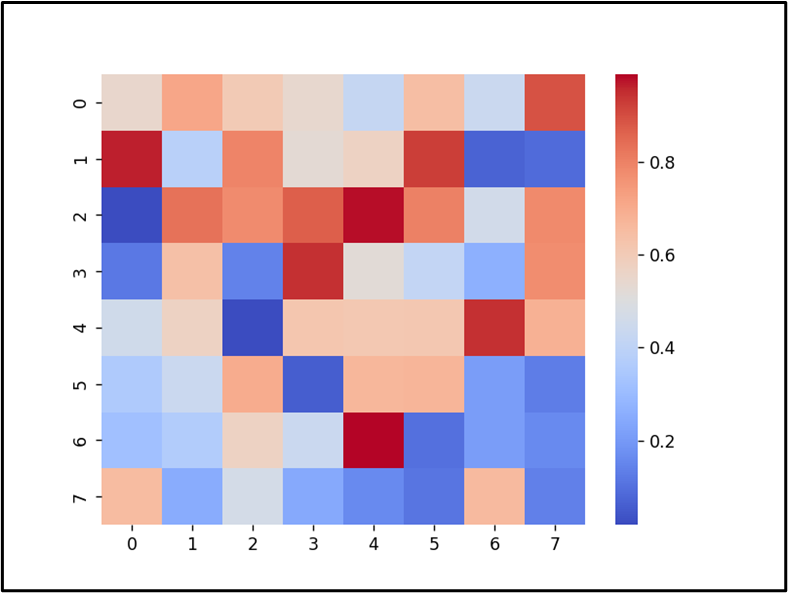
The Seaborn heatmap has been plotted by diverging palette colormap.
Conclusion
The “seaborn.heatmap()” function of the “Seaborn” module is utilized in Python to plot/create rectangular data in the color-coded matrix form. This function is used to plot the heatmap with various colormaps, such as sequential and diverging colormaps. We can also set the maximum and minimum value of the colorbar of the seaborn heatmap by passing the parameter value to the “heatmap()” function. This tutorial delivered a detailed guide on seaborn heatmap colors using numerous examples.
Source: linuxhint.com