Seaborn Figure Size
“Seaborn” is a popular Python library for data visualization that provides a variety of plot types and styles. Adjusting figure size is an important operation while plotting the “Seaborn” plot in Python. Python provides various methods to change the Seaborn figure size. This write-up will present a detailed guide on modifying the Seaborn figure size using various methods.
How to Change/Modify the Seaborn Figure Size in Python?
To change the seaborn figure size, the following methods are used in Python:
Method 1: Change the Seaborn Figure Size Using the “matplotlib.pyplot.subplots()” Method
The “matplotlib.pyplot.subplots()” method is used to change the width and height or figure size of the seaborn plot by using the “figsize” parameter.
Example
The following example code is used to change the seaborn figure size:
import seaborn
import matplotlib.pyplot as plt
df = pandas.DataFrame({"Team-1": [10, 12, 17, 24, 19, 33, 15],
"Team-2": [3, 4, 7, 10, 12, 19, 9]})
fig, ax = plt.subplots(figsize=(9, 5))
seaborn.lineplot(x="Team-1", y="Team-2", data=df)
plt.show()
In the above code:
- The “pandas”, “seaborn”, and “matplotlib.pyplot” modules are imported.
- The “pandas.DataFrame()” function is used to construct a DataFrame, which is used as a data set.
- The “plt.subplots()” method takes the “figsize={9, 5}” parameter and changes the seaborn figure size.
- The “seaborn.lineplot()” method plots the line plot based on the specified figure size.
Output
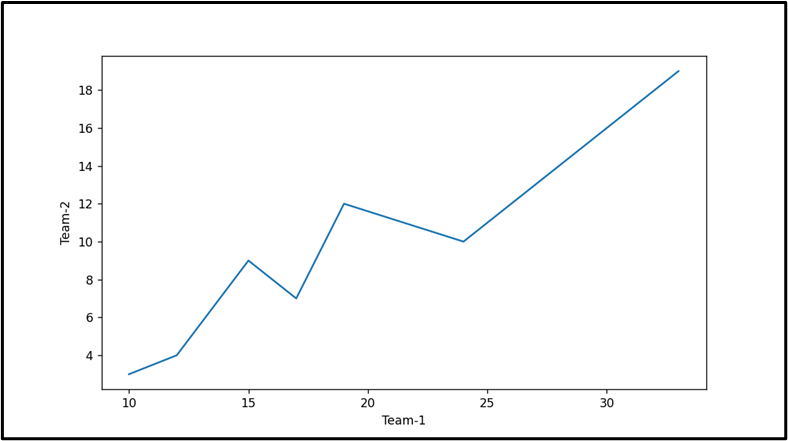
The line plot has been plotted successfully according to the specified figure size.
Method 2: Change the Seaborn Figure Size Using the “seaborn.set()” Method
The “seaborn.set()” method in Python is used to set or assign the figure size of the input plot. The “rc” parameter” in the “seaborn.set()” method is used to pass a dictionary with the key “figure.figsize” and the value as a tuple of “width” and “height” in inches.
Example
The below example code is used to change the seaborn figure size:
import seaborn
import matplotlib.pyplot as plt
df = pandas.DataFrame({"Team-1": [10, 12, 17, 24, 19, 33, 15],
"Team-2": [3, 4, 7, 10, 12, 19, 9]})
seaborn.set(rc={"figure.figsize":(8, 5)})
seaborn.lineplot(x="Team-1", y="Team-2", data=df)
plt.show()
In the above code:
- The “pandas”, “seaborn”, and “matplotlib.pyplot” is imported.
- The “pandas.DataFrame()” function creates the DataFrame and assigns it to the variable “df”.
- The “seaborn.set()” method takes the dictionary of figure size width and height as an argument and changes the figure size.
- The “seaborn.lineplot()” method plots the line plot according to the specified figure size.
Output
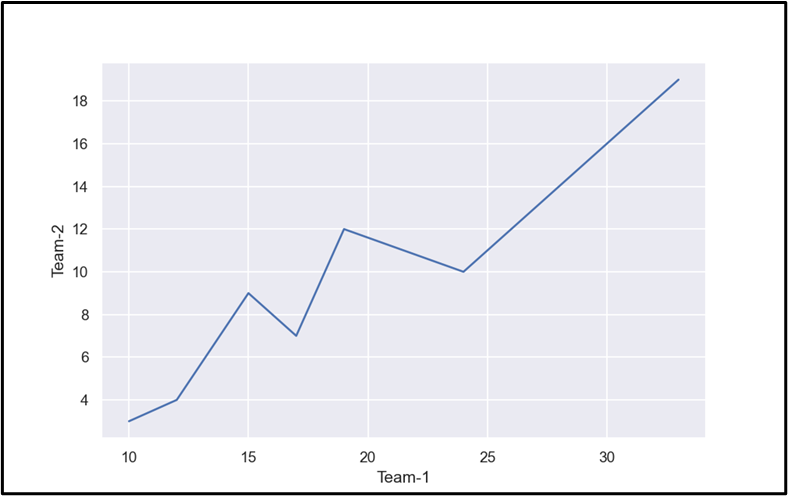
The line plot having the specified figure size has been plotted successfully.
Note: The “seaborn.set()” method is not recommended as it may be removed in the future.
Conclusion
The “matplotlib.pyplot.subplots()” method with the “seaborn.set()” method and the “figsize={width, height}” parameter is used to change the seaborn figure size in Python. The “seaborn.set()” method takes the figure size width and height as an argument and changes the seaborn figure size. The “matplotlib.pyplot.subplots()” method, however, accepts the “figsize” parameter along with a value to change the seaborn figure size. This Python write-up presented a detailed guide on Seaborn’s “figure size” using numerous examples.
Source: linuxhint.com