Seaborn Color Palette
Color is very important for visual layout as it can show or hide various data patterns. In Python, the “Seaborn” library provides various functions that are used to combine colors that fit the data and the visualization. The “seaborn.color_palette()” function of the “seaborn” module is used to provide colors to graphs and work with various color schemes.
This Python post will present a detailed guide on the Seaborn color palette using numerous examples and via the following content:
- What is the “seaborn.color_palette()” Function in Python?
- Using “seaborn.color_palette()” Function With Qualitative Palette
- Using “seaborn.color_palette()” Function With Sequential Palettes
- Using “seaborn.color_palette()” Function With the diverging palette
- Using “seaborn.color_palette()” Function to Create Customized Color Palette
What is the “seaborn.color_palette()” Function in Python?
In Python, the “seaborn.color_palette()” function is used to retrieve the list of colors or continuous colormap. This method is used to customize the colors in seaborn plots.
Syntax
Parameters
In the above syntax:
- The “palette” parameter is used to specify the name of a seaborn palette, a matplotlib colormap, or a sequence of colors.
- The “n_colors” parameter indicates the number of colors to return from the palette.
- The “desat” parameter indicates the amount of desaturation applied to the colors.
- The “as_cmap” parameter specifies the Boolean value that indicates whether the palette is returned as a list of colors or a matplotlib colormap.
Return Value
The “seaborn.color_palette()” function retrieves the list of colors (RGB tuples) or a matplotlib colormap.
Example 1: Using “seaborn.color_palette()” Function With Qualitative Palette
The qualitative palette is used in Python when we have different groups of variables. So, to make them distinct, different colors are used to show them. Each group gets one color from the palette. For more clarity, see the code below:
import matplotlib.pyplot as plt
palette1 = seaborn.color_palette()
seaborn.palplot(palette1)
plt.show()
In the above code:
- The “matplotlib” and “seaborn” modules are imported.
- The “seaborn.color_palette()” method retrieves the list of colors or colormap specifying a palette.
- The “seaborn.palplot()” method plots the colors in the retrieve palette as a horizontal array and displays the plot to the console using the “plt.show()” method.
Output
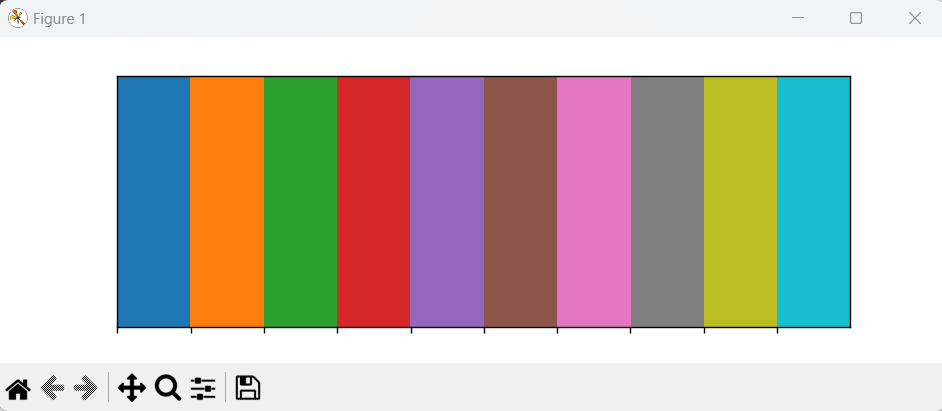
The qualitative color palette has been created and shown in the above output.
Example 2: Using “seaborn.color_palette()” Function With Sequential Palettes
Sequential palettes are used when we want the color moved from lighter to darker or low to high. Here’s a code to illustrate this method:
import matplotlib.pyplot as plt
seaborn.palplot(seaborn.color_palette("Greens"))
plt.show()
In the above code:
- The “seaborn.palplot()” is utilized to plot a palette of colors.
- The “color_palette()” function takes the palette name “Greens” as an argument and retrieves the palette.
Note: To plot a sequential plot, we need to append an additional/extra character “s” to the color palette name.
Output
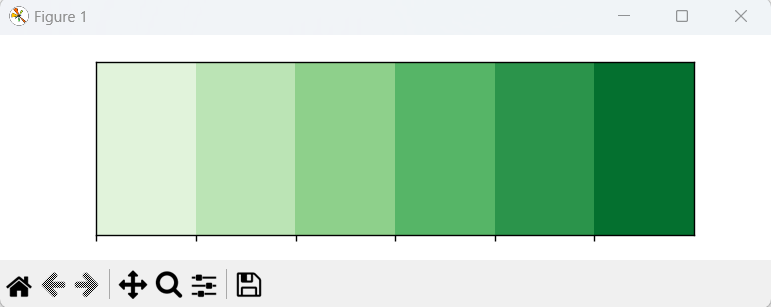
The sequential color palette has been shown in the above output.
Example 3: Using “seaborn.color_palette()” Function With the Diverging Palette
The diverging palette is used when we deal with low and high values or positive or negative values. Here is an example code that visualizes the diverging palette in Python:
import matplotlib.pyplot as plt
seaborn.palplot(seaborn.color_palette("BrBG", 8))
plt.show()
In the above code:
- The “seaborn.color_palette()” function creates the palette of color with “8” colors by taking the palette name “BrBG” as an argument.
- After that, the “seaborn.palplot()” function plots a palette of colors that are balanced between blue and brown.
Output
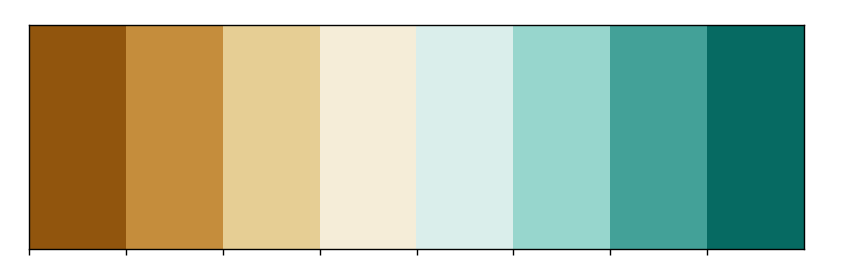
The diverging palette plot has been created.
Example 4: Using “seaborn.color_palette()” Function to Create Customized Color Palette
Let’s overview the following code:
import matplotlib.pyplot as plt
color = ["grey", "green", "white", "red", "yellow", "black"]
seaborn.palplot(seaborn.color_palette(color))
plt.show()
In the above code:
- The list of colors is initialized with various colors.
- The “seaborn.color_palette()” function takes the list of colors and creates the palette.
- The “seaborn.palplot()” function plots the palette of the color.
Output
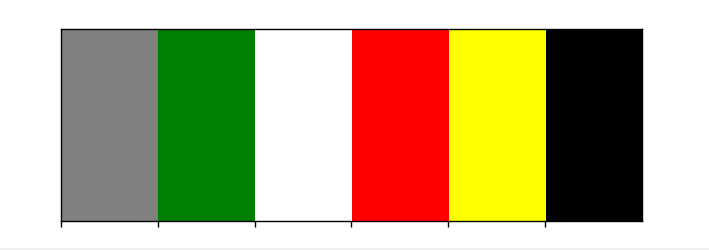
The customized color palette has been plotted successfully.
Conclusion
The “seaborn.color_palette()” function of the “Seaborn” module in Python is used to retrieve the list of colors or continuous colormap. The “seaborn.color_palette()” is used with different palette types, such as qualitative palette, sequential palette, and diverging palette. All of these color palettes are plotted according to the data characteristics. This write-up has provided a comprehensive tutorial on the seaborn color palette using numerous examples.
Source: linuxhint.com