Seaborn Boxplot
The Python “seaborn” library is used for constructing numerical visualization. The “seaborn” provides various functions to plot different graphs, such as histograms, regression plots, etc. The “seaborn.boxplot()” method in Python is used to create the distribution plot with respect to various categories. This Python write-up will present you with a detailed guide on the “seaborn.boxplot()” method via the provided content:
- What is the “seaborn.boxplot()” Method in Python?
- Applying the “seaborn.boxplot()” Method to Create a Boxplot.
- Applying the “seaborn.boxplot()” Method to Create Multiple Horizontal Boxplots.
- Applying the “seaborn.boxplot()” Method to Create a Boxplot With Parameters.
What is the “seaborn.boxplot()” Method in Python?
In Python, the “seaborn.boxplot()” method of the “seaborn” library is used to draw/plot the distributions with respect to categories. As a result of this method, data can be compared across variables or levels of categorical variables.
Syntax
The “seaborn.boxplot()” method’s syntax is as follows:
Parameters
In the above syntax:
- The “x”, “y”, and “hue” parameters specify the input data.
- The “data” parameter specifies the dataset for plotting.
- The “orient” parameter specifies the orientation, such as “horizontal” and “vertical”.
- The “linewidth” parameter specifies the gray line width that frames the plot elements.
- The other optional parameters can perform various operations. To check the detailed syntax, check this documentation.
Return Value
The “seaborn.boxplot()” method retrieves the plot on the axes object.
Example 1: Applying the “seaborn.boxplot()” Method to Create a Boxplot
The below code is utilized to construct a single horizontal boxplot:
import matplotlib.pyplot as plt
data = seaborn.load_dataset("tips")
seaborn.boxplot(y=data["total_bill"])
plt.show()
In the above code:
- The “seaborn” and “matplotlib” modules are imported to create a single horizontal boxplot.
- The “seaborn.load_dataset()” method loads the dataset called “tips”.
- The “seaborn.boxplot()” method is used to create the “boxplot” that displays the min, max, 1st, and 3rd quartile, and others.
Output
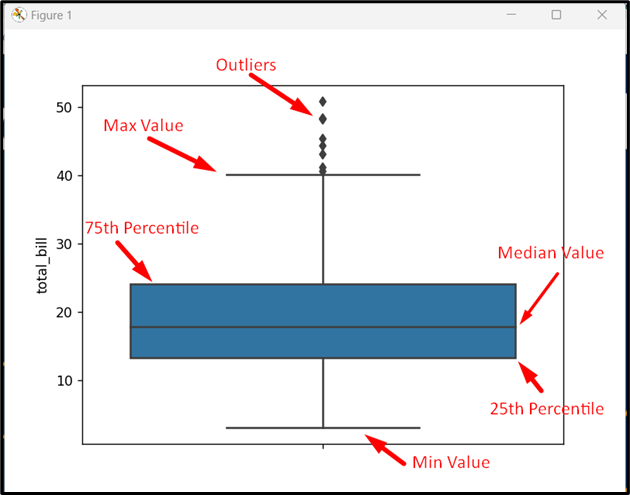
The box plots showing various values have been plotted in the above output.
Example 2: Applying the “seaborn.boxplot()” Method to Create Multiple Horizontal Boxplots
The below code is used to create multiple horizontal boxplots:
import matplotlib.pyplot as plt
data = seaborn.load_dataset("tips")
seaborn.boxplot(y=data["sex"], x=data["total_bill"])
plt.show()
In the above code lines, the “seaborn.boxplot()” method takes the categorical “y” and “x” variables as its arguments to plot multiple horizontal boxplots. To plot the boxplot in the normal direction, interchange the value of “x” with the “y” coordinate.
Output
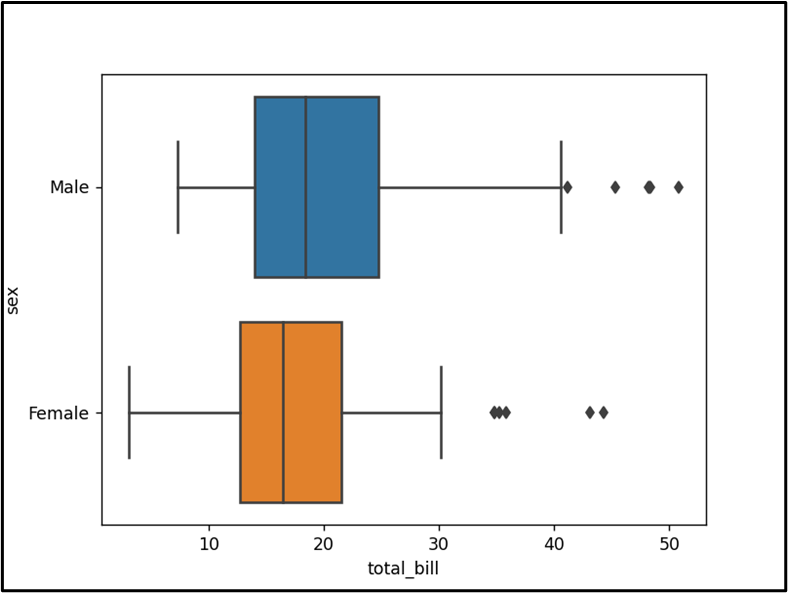
The multiple boxplots have been displayed successfully.
Example 3: Applying the “seaborn.boxplot()” Method to Create a Boxplot With Parameters
The “seaborn.boxplot()” method provides various parameters that can also be used to create a boxplot, as follows:
import matplotlib.pyplot as plt
data = seaborn.load_dataset("tips")
seaborn.boxplot(y=data["sex"], x=data["total_bill"], width=0.3, palette="Blues")
plt.show()
In the above code, the “seaborn.boxplot()” method takes the “y” and “x” parameters along with the optional parameters “width” and “palette” to plot the boxplot. Here, the “width” and “palette” parameters set the width and color of the boxplot, respectively.
Output
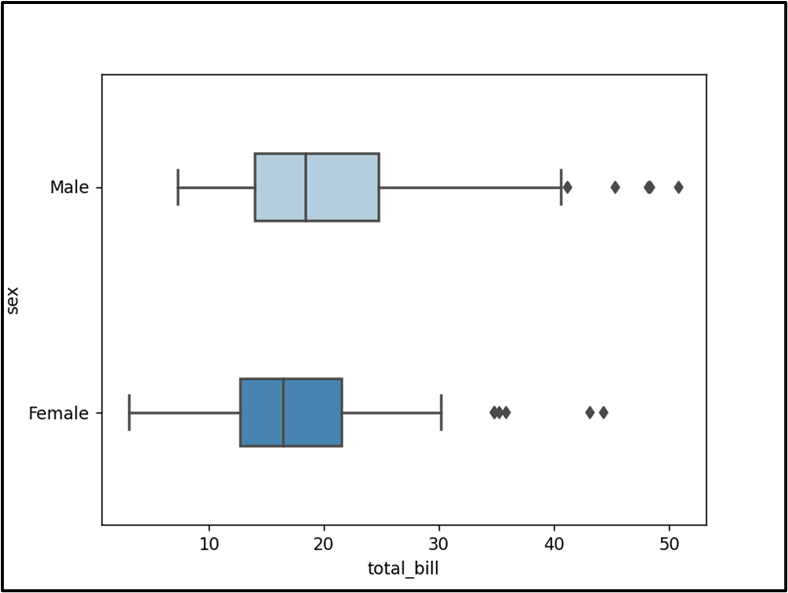
The boxplots have been displayed with the specified boxplot “color” and “width”, accordingly.
Conclusion
The “seaborn.boxplot()” method of the “seaborn” library in Python is used to draw/plot the distributions with respect to categories. This method is used to create a horizontal or vertical boxplot and customize it using various parameters such as “width”, “palette”, “color”, etc. This write-up presented an in-depth guide on Python’s “seaborn.boxplot()” method using various examples.
Source: linuxhint.com