SciPy T-Test
SciPy library in Python is used for various purposes, such as interpolation, performing algebraic operations, image processing, etc. In Python, “SciPy” supported different sub-packages or modules, such as “scipy.stats”, “scipy.optimize”, “scipy.io”, and many more, to perform different tasks. To calculate the t-test for the mean of one, two, or paired/related samples of scores, various methods are used in Python.
This article will present a complete overview of performing the SciPy t-test using numerous examples and via the below content:
- How to Perform SciPy T-Test in Python?
- Performing One Sample T-Test Using “scipy.stats.ttest_1samp()”
- Performing Two-sample T-Test Using “scipy.stats.ttest_ind()”
- Performing Paired T-Test Using “scipy.stats.ttest_rel()”
How to Perform Scipy T-Test in Python?
To perform one sample, two samples, or paired sample t-test, the “scipy.stats.ttest_ind()”, “scipy.stats.ttest_1samp()”, and “scipy.stats.ttest_rel()” methods are used in Python. These methods retrieve the “t-statistics” and “p-value” as an output.
The “t-statistic” measures the sample and population mean difference, and the “p-value” specifies the probability of observing the t-statistics, specifying that the null hypothesis is true. Here, the null hypothesis means that the sample mean is equivalent to the population mean.
Syntax of scipy.stats.ttest_ind()
In the above syntax:
- The “a” and “b” parameters represent the input arrays or objects containing the samples to be compared.
- The “axis” parameter specifies/represents the axis along which the samples are compared. (Default 0)
- The “equal_var” parameter determines whether the equal variances are assumed or not. (Default True)
- The “nan_policy” parameter is used to handle the missing value “NaN”.
- The additional parameters are not mandatory and are used for specific operations.
Syntax of scipy.stats.ttest_1samp()
Here, the “a” parameter represents the input data array, and the “popmean” parameter represents the population mean value that is being used to compare the sample mean. The additional parameters are optional and can be used for certain operations.
Syntax of scipy.stats.ttest_rel()
In this syntax, the “a” and “b” parameters represent the set of two sample data that need to be compared. The additional parameters are optional and are similar to the previous syntaxes.
Example 1: Performing One Sample T-Test in Python
The below code is used to determine the one-sample t-test in Python:
import scipy
x = numpy.random.randn(15)
t_stat, p_val = scipy.stats.ttest_1samp(a=x, popmean = 10)
print(t_stat)
print(p_val)
In the above code:
- Initially, imported the required libraries “numpy” and “scipy” respectively.
- Then, used the “numpy.random.randn()” method to generate random numbers following a standard normal (Gaussian) distribution with a mean “0” and standard deviation “1”.
- After that, the “scipy.stats.ttest_1samp()” method takes the sample data parameter “a” as an argument and performs a one-sample t-test. This method determines whether the sample mean significantly differs from a known population mean “10”.
Output
Here is an output of the above-described code:
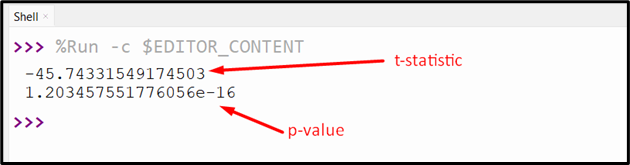
The above snippet shows the t-statistic and the p-value.
Example 2: Performing Two-sample T-Test in Python
Let’s check out the provided code to perform a two-sample t-test in Python:
import scipy
x = numpy.random.randn(11)
y = numpy.random.randn(15)
t_stat, p_val = scipy.stats.ttest_ind(x, y)
print(t_stat)
print(p_val)
Here:
- First, imported the required modules named “numpy” and “scipy”.
- Next, the “numpy.random.randn()” method takes the sample size as an argument to generate the sets of data following a standard normal (Gaussian) distribution with specified mean and variance.
- Then, used the “scipy.stats.ttest_ind()” method to execute a two-sample t-test on the two data sets.
Output
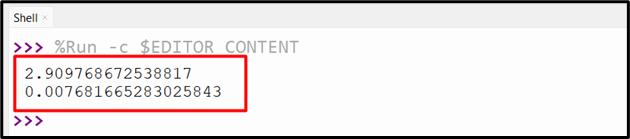
The t-statistic and p-value are shown in the above output.
Example 3: Performing Paired T-Test in Python
The following code is utilized for performing paired t-tests in Python:
import scipy
x = numpy.random.randn(15) + 8
y = numpy.random.randn(15) + 9
val = scipy.stats.ttest_rel(x,y)
print(val)
According to the above code:
- First of all, we imported the “numpy” and “scipy” libraries. Then, added the “numpy.random.randn()” method to take the sample size and generate random numbers from a standard normal distribution with the specified mean and variance.
- Next, the “scipy.stats.ttest_rel()” method performs a paired t-test on the input sets of data “x” and “y”.
Output
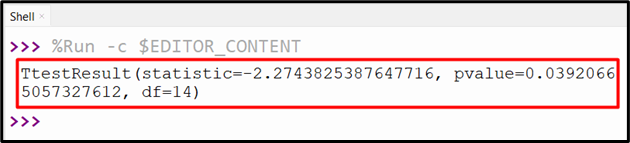
The t-statistic and p-value are shown in the above snippet.
Conclusion
The “scipy.stats” module includes “ttest_ind()”, “ttest_1samp()”, and “ttest_rel()” methods that perform one sample, two samples, or paired sample t-test in Python. These methods are used to find and compare the means of the specified two groups. This article delivered detailed information about performing a Scipy t-test using numerous examples.
Source: linuxhint.com