SciPy Stats Pearsonr
There are several Python libraries that offer various functions and modules to perform simple as well as complex tasks. “Scipy” is one such library in Python that is used for various purposes such as signal processing, image optimization, statistical calculation, etc. The “Pearsonr” corresponds to a function of this library that refers to the “Pearson correlation coefficient” and ranges from “-1” to “1”. We can determine the “Pearson correlation coefficient” utilizing the “pearsonr()” function of the “scipy.stats” module in Python.
This Python post presents a detailed guide on the SciPy Stats “pearsonr()” function using numerous examples.
What is the “scipy.stats.pearsonr()” Function in Python?
The “scipy.stats.pearsonr()” function in Python is a part of the “scipy” library, which is specifically used to calculate the “Pearson correlation coefficient” between two arrays or lists of values. “Pearson correlation coefficients” measure/calculate how reasonably two variables correlate.
Syntax
In the above syntax:
- The “x” and “y” parameters are the input arrays or lists containing the values for which the correlation coefficient needs to be calculated.
- The third parameter named “alternative” specifies a string that defines the alternative hypothesis for the test. It can be “two-sided”, “less” or “greater”.
Return Value
The “scipy.stats.pearsonr()” function returns two values:
- Pearson correlation coefficient: It ranges between “-1” and “1”, where “-1” specifies a perfect negative linear relationship, “1” indicates a perfect positive linear relationship, and “0” corresponds to no linear relationship.
- p-value: The p-value is associated with the hypothesis test for the correlation coefficient.
Example 1: Calculating the “Pearson Correlation Coefficient”
In the below example code, the “stats.pearsonr()” function is utilized to determine the Pearson correlation coefficient:
from scipy import stats
value_1 = numpy.array([65, 70, 68, 61, 72])
value_2 = numpy.array([150, 160, 155, 140, 175])
correlation, p_value = stats.pearsonr(value_1, value_2)
print(correlation)
print(p_value)
According to the above code:
- The “numpy” library and the “stats” module are imported and the two arrays are initialized.
- The “pearsonr()” function takes both the arrays as its arguments and assigns the returned values to “correlation” and “p_value”. This function calculates the “Pearson correlation coefficient” of the given two arrays.
Output
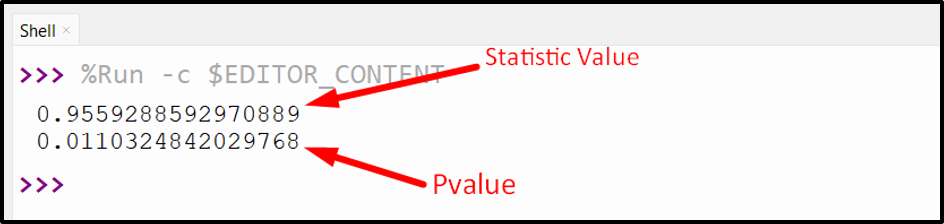
The positive floating numbers of statistics and “P-value” indicate that these two datasets have highly positive coefficients.
Example 2: Calculate the Correlation Coefficient and P-value of Two Random Arrays
Here is an example code that is used to determine the correlation coefficient and p-value:
from scipy import stats
value_1 = numpy.random.rand(10)
value_2 = numpy.random.rand(10)
correlation, p_value = stats.pearsonr(value_1, value_2)
print(f"Correlation coefficient: {correlation:.3f}")
print(f"P-value: {p_value:.3f}")
In the above code:
- The “random.rand()” method generates two random arrays with size “10”.
- The “pearsonr()” function calculates the “Correlation Coefficient” and the “P-Value”.
Output
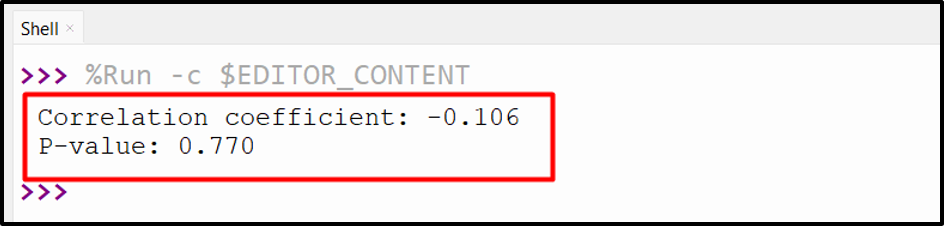
In the above output, it can be seen that the correlation coefficient value is retrieved as “-0.106” which specifies the weak negative correlation, and the p-value value “0.770” specifies the null hypothesis as “True”.
Conclusion
The “scipy.stats.pearsonr()” function in Python is a powerful tool for calculating the “Pearson correlation coefficient” between variables. It delivers a convenient/simple way to measure the linear relationship between two arrays or a list of values. This blog presented a thorough guide on Python’s “stats.pearsonr()” function of the “scipy” library using appropriate examples.
Source: linuxhint.com