Scipy Stats Fit
Python has many libraries of packages that help to solve operations or tasks easily and efficiently. “Scipy” is a library package that provides a wide range of built-in functions for machine learning, optimization, and data analysis. One such function is “Scipy stat fit”, which is used to analyze the data and identify the best-fit parameters based on the various distributions.
This tutorial delivered a detailed overview of Scipy Stats Fit using the below contents:
- What is the Scipy Stats Fit in Python?
- Fitting Data to Normal Distribution Using “scipy.stats.norm.fit()” Method
- Fitting Data to Gamma Distribution Using “scipy.stats.gamma.fit()” Method
- Fitting Data to Exponential Distribution Using “scipy.stats.expon.fit()” Method
- Fitting Data to Beta Distribution Using “scipy.stats.beta.fit()” Method
- Fitting Data to Pareto Distribution Using “scipy.stats.pareto.fit()” Method
What is the Scipy Stats Fit in Python?
The “scipy.stats” module in Python provides several functions and distributions that are used to fit the specified data on different distributions. These distributions include normal, gamma, exponential, beta and others. The “fit()” function is employed to estimate/evaluate the parameters of a probability distribution based on the given set of data.
Let’s explore all of these methods and fit the sample set of data to various distributions.
Example 1: Fitting Data to Normal Distribution Using “scipy.stats.norm.fit()” Method
The below code is used to fit the data to the normal distribution:
data = scipy.stats.norm.rvs(1, 1, size=400, random_state=140)
print(scipy.stats.norm.fit(data))
In this code:
- The “scipy” module is imported.
- Next, the “scipy.stats.norm.rvs()” method is used to create random sample numbers from a normal distribution. This method takes the random sample value “400”, mean “1”, standard deviation “1”, and random_State value “140” as an argument.
- At last, the “stats.norm.fit()” method is used to estimate the parameters of the normal distribution that best fit the generated data.
Output
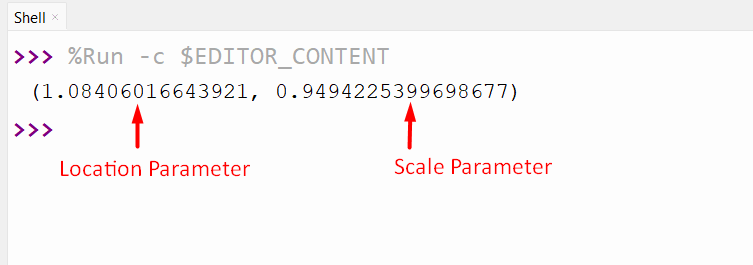
The best normal distribution parameter values have been demonstrated in the above snippet.
We can also display the location and scale parameters distribution values separated by unpacking the return value of the “scipy.stats.norm.fit()” method:
data = scipy.stats.norm.rvs(1, 1, size=400, random_state=140)
loc, scale = scipy.stats.norm.fit(data)
print(loc, '\n')
print(scale)
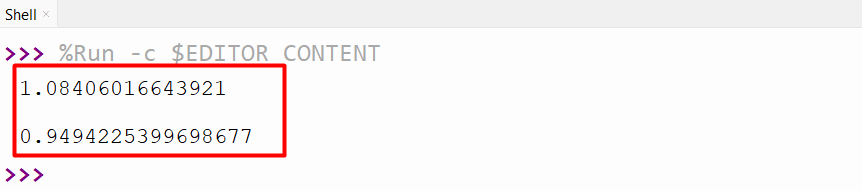
The below output displays the separate value for the location and scale parameters value:
Example 2: Fitting Data to Gamma Distribution Using “scipy.stats.gamma.fit()” Method
Let’s overview the following/below example code for gamma distribution:
x_data = scipy.stats.gamma.rvs(1,size=400, random_state=140)
print(scipy.stats.gamma.fit(x_data))
In this code:
- The “scipy.stats.gamma.rvs()” method creates the random sample data from a gamma distribution.
- Next, the “scipy.stats.gamma.fit()” method is used to determine the maximum likelihood estimation parameters of the gamma distribution for the specified data.
Output
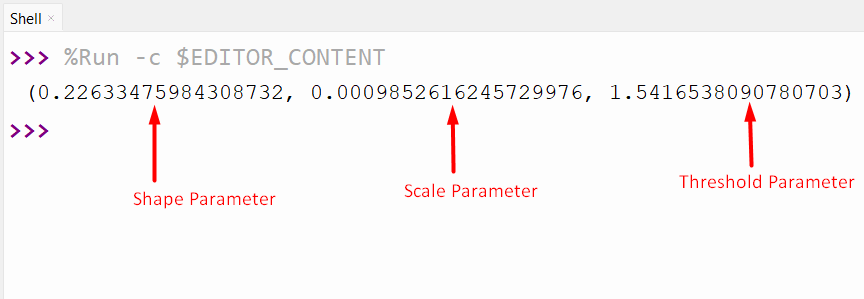
The tuple containing the shape, scale and threshold parameters values have been displayed in the above output.
Example 3: Fitting Data to Exponential Distribution Using “scipy.stats.expon.fit()” Method
In this code, the “scipy.stats.expon.fit()” method is used to fit the data to exponential distribution:
x_data = scipy.stats.expon.rvs(size=600, random_state=140)
print(scipy.stats.expon.fit(x_data))
Here,
- The “stats.expon.rvs()” method is used to generate random numbers from the exponential distribution with a specified random size and a state value.
- Next, the “stats.expon.fit()” method is used to estimate the parameters of the exponential distribution that best fits the given data.
Output
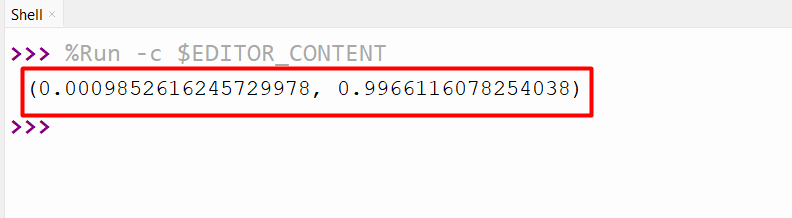
The shape and location parameters of the distribution based on the data have been retrieved successfully.
Note: You can also check our dedicated article named SciPy Exponential Distribution for a detailed understanding.
Example 4: Fitting Data to Beta Distribution Using “scipy.stats.beta.fit()” Method
The “beta” distribution is utilized to fit random variables whose values are placed within the specified input range. Let’s explore this via the following example code:
x_data = scipy.stats.beta.rvs(1, 1, size=800, random_state=120)
print(scipy.stats.beta.fit(x_data))
In this code, the “scipy.stats.beta.fit()” method takes the random data and fits or generates the parameters that best fit the beta distribution.
Output
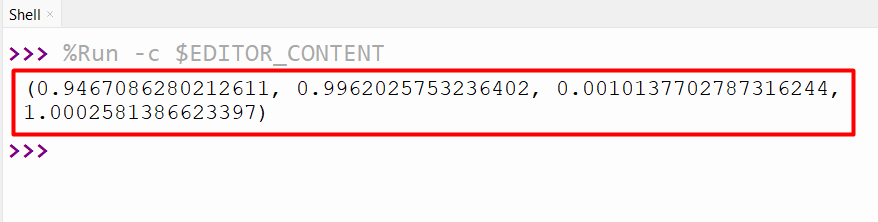
The best parameters for the beta distribution have been demonstrated in this output.
Example 5: Fitting Data to Pareto Distribution Using “scipy.stats.pareto.fit()” Method
Here is an example code for fitting data to pareto distributions:
x_data = scipy.stats.pareto.rvs(1.3, size=800, random_state=100)
print(scipy.stats.pareto.fit(x_data))
Here, the “scipy.stats.pareto.fit()” method accepted the generated data as an argument and retrieved the parameters that best fit the pareto distribution.
Output
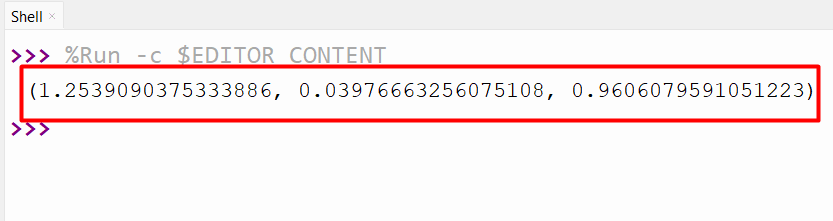
The shape, location and scale parameters best values have been retrieved successfully.
Conclusion
The “scipy.stats” module of the “Scipy” library is used along with several distribution functions, such as “norm()”, “expon()”, and “beta()” to fit the data on these distributions. With all of these distributions, the “fit()” function is used to estimate/evaluate the probability distribution parameters. This guide delivered a detailed guide on Scipy Stats Fit method using numerous examples.
Source: linuxhint.com