SciPy Signal Processing
“Signal Processing” involves manipulating and analyzing signals to extract valuable information or enhance the quality of the signals. It consists of a wide range of techniques, including filtering, noise reduction, spectral analysis, time-frequency analysis, and more. In Python, the “scipy” library provides a dedicated signal processing module named “scipy.signal”.
This article provides a thorough guide on Python “Scipy Signal Processing” using numerous examples.
How to Use the Python SciPy Signal Processing?
The “scipy” signal processing library is a collection of Python modules that provide a wide range of signal processing tools for analyzing the signal, detecting and removing noise from the signal, calculating the convolution of the signal, etc. The “scipy.signal” module is imported from the “scipy” library and used with a variety of signal processing functions to perform various signal processing operations.
Let’s understand it via the following examples:
Example 1: Convolution of Two Arrays
Convolution is a fundamental operation in signal processing that combines two functions to produce a third function representing the modification of one function by the other. To perform convolution in “SciPy”, the “convolve()” function from the signal processing module is used in the below code:
from scipy import signal
x = numpy.array([1, 2, 3, 4, 5])
h = numpy.array([0.5, 0.25, 0.125])
y = signal.convolve(x, h)
print(y)
In the above code snippet:
- The “numpy” library and the “signal” module (from the “scipy” library) are imported, respectively.
- The “array()” function is used to create the arrays “x” and “h”.
- The “convolve()” function takes the “x” and “h” arrays as arguments and performs a discrete linear convolution of two one-dimensional arrays.
Output
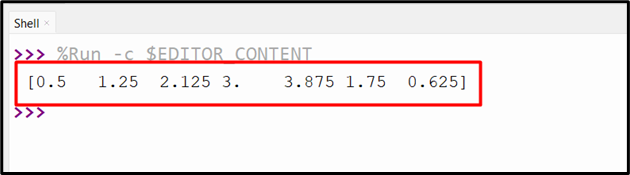
The convolution of two given arrays has been displayed.
Example 2: Finding Peaks in a Signal
The “scipy.signal” module also provides functions for finding peaks in a signal. Here’s an example using the “signal.find_peaks()” function:
from scipy import signal
import matplotlib.pyplot as plt
# Generate a simple signal with peaks
t = numpy.linspace(0, 1, 1000)
x = numpy.sin(4 * numpy.pi * t) + numpy.sin(10 * numpy.pi * t)
# Find peaks in the signal
peaks, _ = signal.find_peaks(x)
# Plot the signal and peaks
plt.plot(t, x)
plt.plot(t[peaks], x[peaks], 'ro')
plt.xlabel('Time')
plt.ylabel('Amplitude')
plt.show()
According to the above code:
- The signal with two sine waves of different frequencies is generated using the “sin()” function.
- The “find_peaks()” function is used to find the peaks in the signal.
- Finally, the red circles are drawn around the detected peaks in the signal plot using the “plot()” function.
Output
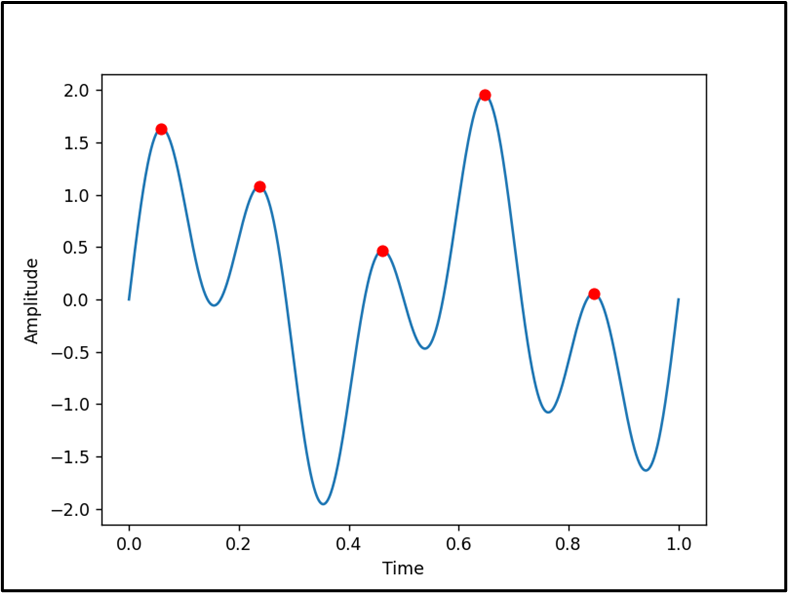
In the above output, the peak points in the signal have been shown.
Example 3: Cross-correlation of Signals
This example uses the scipy “signal.correlate()” function to compute the cross-correlation between two signals:
from scipy import signal
# Generate two example signals
x = numpy.array([1, 2, 3, 4, 5])
y = numpy.array([5, 4, 3, 2, 1])
# Compute the cross-correlation
correlation = signal.correlate(x, y, mode='same')
print(correlation)
In the above code lines:
- The two signals “x” and “y” are created using the “array()” function.
- After that, the “correlate()” function is utilized to determine the cross-correlation between the two particular signals.
Output

The cross-correlation between the given signals has been calculated accordingly.
Conclusion
The “scipy.signal” module provides various functions that are used to perform the convolution of two arrays, find peaks in a signal, apply cross-correlation of signals, etc. This article explored the capabilities and uses of SciPy’s signal processing in Python.
Source: linuxhint.com