Quantile in R
Before constructing any machine learning algorithms on a dataset, inferential statistical analysis is essential. Obtaining statistical inferences from data is also part of this process. In statistics, a few key concepts describe the variability of a numeric variable. These terms are IQR, quartiles, quantiles, mean, and median. They assist in identifying any anomalies in the column and the column’s distribution. This post is for determining the column’s quantile. The data’s variability is measured using the quantile functions. After sorting the data, you may use quantiles to divide the numbers in a given distribution into equal subgroups. We can easily calculate quantiles in R using the quantile function, which returns all quantiles of 0%, 25%, 50%, 75%, and 100%.
Quantiles in R Programming Language in Ubuntu 20.04
Quantile is a generic function that generates sample quantiles for specified probabilities. A probability of 0 corresponds to the smallest observation, while a probability of 1 corresponds to the biggest. There, we have syntax for quantiles used in an R programming language.
|
1
|
quantile(x, probs = seq(0, 1, 1/4), na.rm = FALSE, names = TRUE, type = 5, digits = 5, ...)
|
The following is a description of the previous argument passed inside the quantile function:
X: An item of a category for which a function has been specified or a numeric vector where sample quantiles are required. Unless na.rm is “TRUE”, NA and NaN values cannot be used in numeric vectors.
probs: The probability with values in a numeric vector; values outside of that range up to “2e-14” are recognized and transferred to the following closest endpoint.
na.rm: If true, any NA and NaN values in x are eliminated before the quantiles are evaluated.
Names: When true, the feature includes a name attribute. Set to “FALSE” to reduce the time it takes to solve a problem with a large number of variables.
Digits: When true, implement the precision to utilize formatting percentages. Internally, in R versions prior to 4.0.x, this was set to max (2, getOption(“digits”)).
This article will teach you what quantiles are and how to compute them in R (quartiles, octiles, deciles, and percentiles). To get sample quantiles for a dataset, use the quantile() utility in R.
Example 1: Using a Simple Quantile Function for Commuting Vectors in R in Ubuntu 20.04
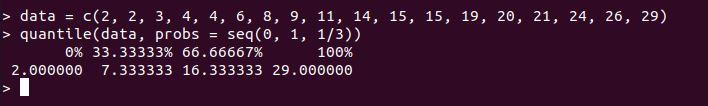
Let’s look at how the quantile function in R works with a simple example that generates the quantiles for the data input. We need to create data for applying the quantile functions. Here, we have defined the variable data inside, which contains the vector’s data. Then, the quantile function is used where we have passed the previously specified data along with the declared sequence. When executing this quantile function command, we got the quantiles of the vectors as shown in the following R prompt:
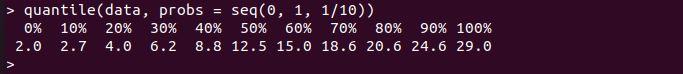
In the following R prompt, we have again utilized the quantile function for computing the deciles. For this, we have passed the sequence 0, 1, and ¼.
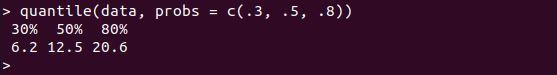
Here, we have evaluated the interest for the random quantiles. We have set the data inside the probs argument, simultaneously showing the percentiles’ output. Note that the quantile function split the data into equal portions, with the median serving as the center, the remaining lower half serving as the lower quartile, and the higher half serving as the upper quartile.
Example 2: Using the Quantiles Function for Computing the Column in a Data Frame in R in Ubuntu 20.04
We can also find the quantile of the given column from the data frame. We have defined the data inside the data frame function in the following R script. We have generated lists with the names “List1”, “List2”, and “List3” having random numerical values.

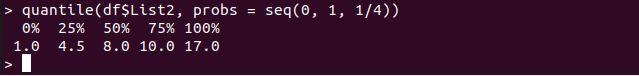
After that, call the quantile function and input the column name with the symbol “$” like how we have specified “$List3” for quantile. As you can see, the quantile function puts the input values in ascending order before returning the needed percentiles.
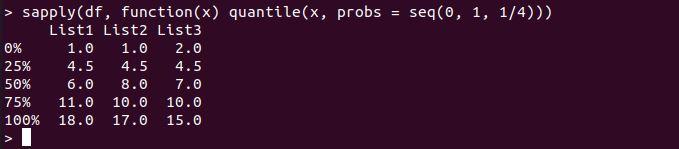
We can use the sapply() function as shown inside the R prompt if we want to evaluate the quantiles of numerous columns at once. We have passed the function(x) option inside the sapply function along with the quantile function, which has the parameters x and probs. The output from this function displays all the quantiles of the columns at once.
Example 3: Using the Quantiles Function and Handling the NaN Error in R in Ubuntu 20.04
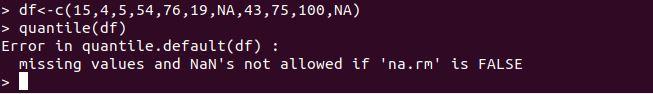
NaNs can be found in almost any situation. These NaNs, also known as missing values, are becoming more common in today’s data-driven digital world. If the data contains these missing numbers, the output may contain NaNs or errors. We also have vector data that includes some NA values called the vector data in the quantile function. The exception is thrown by the R compiler shown below:
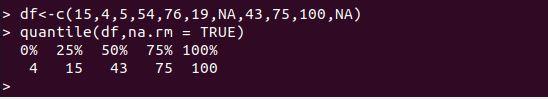
We can remove this error by using the quantile parameter na.rm. We have to set the na.rm value to “true”, which helps us eliminate this NaNs exception. As you can see in the output, we got the percentile values and successfully removed the NA values.
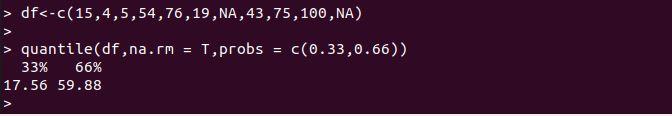
Example 4: Using the Quantiles Function With Probs Parameter in R in Ubuntu 20.04
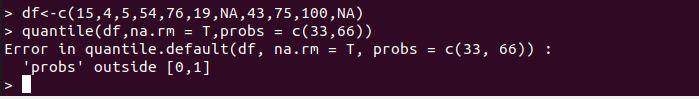
There is also the “probs” option, which allows you to specify the required percentiles. The probs argument, also known as the “probabilities” argument, should be between 0 and 1. Inside the following R script, we have used the probs option with the values 33 and 66 within the quantile function. The output has an error message that probs are outside the range.
When setting the probs option within the range of 0 and 1, it shows the percentiles values rather than false values.
Conclusion
We have tried to do our best to describe and explore the R quantile() function in several dimensions using various examples. The quantile form is the most valuable function in data analysis since it efficiently shows additional data on specific information. We have illustrated some examples showing the working of the quantile function clearly. I hope you now understand the R’s quantile() function better.
Source: linuxhint.com