Python Statistics Standard Deviation
“Standard Deviation” is a key concept in statistics that measures/analyzes how much values in a dataset vary from the mean. This approach helps to understand how consistent or diverse the data is and how reliable the mean value is as a summary statistic. Python provides different methods to determine the standard deviation, such as the “statistics.stdev()” method.
To determine the Python statistics standard deviation, follow the below outline:
What is the “statistics.stdev()” Method in Python?
The “statistics.stdev()” method finds the standard deviation of a sample of data. A high standard deviation signifies that the data values are far apart from each other and the average. A low standard deviation, however, implies that the data values are close together and close to the average.
Syntax
In the above syntax:
-
- The “data” parameter determines which data values will be used (any sequence, list or iterator is allowed).
- The “xbar” parameter specifies the mean of the given data.
Note: “Standard Deviation” uses the same units as the data, unlike variance, which uses squared units. Also, “Standard Deviation” is the square root of variance.
Example 1: Determining the Standard Deviation
The below example is utilized to specify the standard deviation:
print(statistics.stdev([22, 33, 45, 17, 39, 6]))
print(statistics.stdev([-11, 2.5, -4.2, 1.2]))
In the above code, the “statistics.stdev()” function is utilized to compute the standard deviation of the input sample data in both cases.
Output
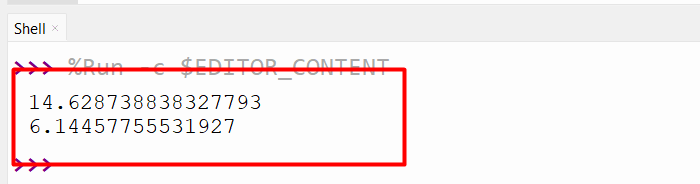
The standard deviation in each case has been calculated accordingly.
Example 2: Determining the Standard Deviation Utilizing the “xbar” Parameter
Let’s overview the below code that utilizes the discussed parameter to compute the standard deviation:
data = (2, 5, 10, 20, 30, 44)
mean_data = statistics.mean(data)
print(statistics.stdev(data, xbar = mean_data))
In these code lines, the “statistics.stdev()” method is used to determine the standard deviation by accepting the “data” and “xbar” arguments. There is nothing special about the “xbar” parameter except that it stores the sample’s mean.
Output
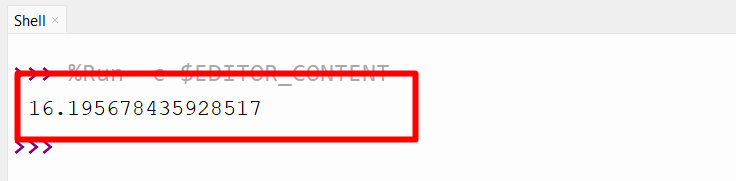
The standard deviation has been computed.
Alternative Approaches to Determine/Calculate the Standard Deviation
The following examples use various alternative approaches to determine the standard deviation.
Example 1: Determining the Standard Deviation Using the “numpy.std()” Method
The below code snippet is used to determine the standard deviation based on the “numpy.std()” method:
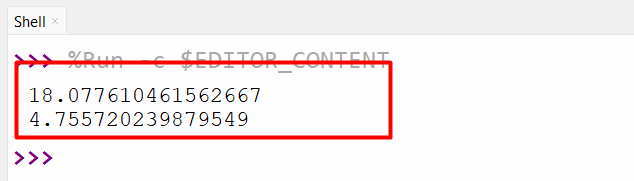
print(numpy.std([22, 33, 54, 12, 59]))
print(numpy.std([-5, 5.5, -4.2, 4.2]))
In this code, the “numpy.std()” method takes the sample data as an argument and determines the corresponding standard deviation in each case.
Output
Example 2: Determining the Standard Deviation Using the “pandas.std()” Method
Here is an example code:
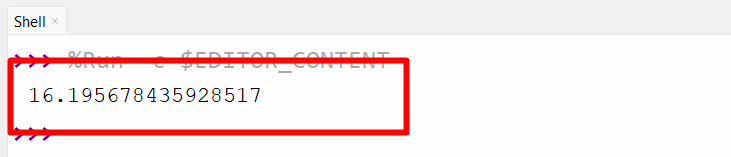
data = [2, 5, 10, 20, 30, 44]
df = pandas.DataFrame(data, columns=['Data'])
print(df['Data'].std())
In the above block of code, the “pandas.DataFrame()” function takes the created dictionary and stores the result in “df”. The associated “std()” function of the “pandas” module then determines the corresponding standard deviation.
Output
Conclusion
The “statistics.stdev()” method of the “statistics” module is utilized to determine/calculate the standard deviation of a sample of data in Python. We get the standard deviation by taking the variance square root. Alternative approaches such as “numpy.std()” and “pandas.std()” methods can also determine the standard deviation. This blog presented multiple ways to determine the statistics standard deviation with relevant examples.
Source: linuxhint.com