Plotly.Graph_objects.scattermapbox
Keep in mind that you will require a Mapbox account and access token to access the Mapbox API and create various types of plots.
To learn more about that, check our tutorial on the plotly set_mapbox_access_token function.”
That being said, let’s dive in.
Mapbox Access Token Configuration
Let’s start by setting up the Mapbox access token. In your Mapbox account, locate your access token and copy it.
On your local machine, create a file ending with. mapbox_token extension. Keep in mind that the extension is not required but can help you quickly distinguish the file.
Once created, paste the access token you copied earlier. Save the file and close.
Next, create your notebook and load the access token as shown in the code below:
px.set_mapbox_access_token(open(‘access.mapbox_token’).read())
The code above will import plotly express and set your mapbox_access_token from the specified file.
Feel free to replace the access.mapbox_token filename with the path to the mapbox access token file you created earlier.
Once completed, we can proceed to create a scatter plot on a map.
Basic Example
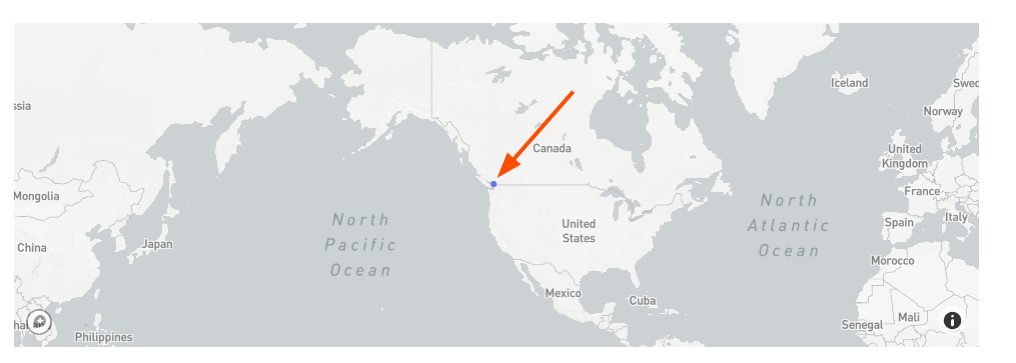
To illustrate, we will create a scatter marker on the city of “Surrey” by specifying its latitude and longitude values.
Take the code as shown below:
fig = go.Figure(data=go.Scattermapbox(
lat=[‘49.1913’],
lon=[‘-122.801094’],
mode=‘markers’,
text=‘Surrey, BC’
))
fig.update_layout(
mapbox=dict(
accesstoken=mapbox_access_token,
bearing=0,
center=go.layout.mapbox.Center(
lat=49,
lon=–122
),
zoom=1,
pitch=0
))
The code above will create a scatter marker on the specified lat and long values. The resulting map is as shown:
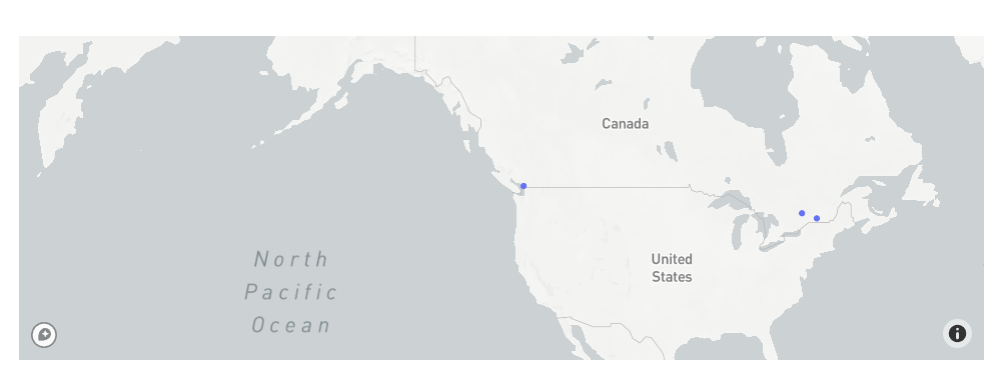
You can also include multiple markers by specifying the latitude and longitude values as:
fig = go.Figure(data=go.Scattermapbox(
lat=[‘49.1913’, ‘45.508888’, ‘46.099998’],
lon=[‘-122.801094’, ‘-73.561668’, ‘-76.050003’],
mode=‘markers’,
text=‘Surrey, Montreal, Gracefield’
))
fig.update_layout(
mapbox=dict(
accesstoken=mapbox_access_token,
bearing=0,
center=go.layout.mapbox.Center(
lat=49,
lon=–122
),
zoom=2,
pitch=0
))
This should create multiple markers at the specified locations as shown in the output map:
Conclusion
This article explores how to create scatter markers on maps using the scattermapbox class from Plotly graph_objects and Mapbox API.
Source: linuxhint.com