Plot Vertical Line in MATLAB (xline function)
In the following article, we will explain how to use the MATLAB function xline() to create vertical lines and insert them into a graph. These types of lines are often used as markers in graphs and charts. Therefore, we will also show you how to add text labels to these lines so that you can fully master this function in MATLAB. We have also included practical examples with code snippets and images in this article to better explain how you can create or draw vertical lines in this powerful programming environment for scientific computing. We also review the input arguments and data types accepted by xline(). We will also explain how to use each of these arguments to specify the desired attributes for the line you want to create.
MATLAB xline Function Syntax
xline ( x, LineSpec )
xline ( x, LineSpec, labels )
Description and Examples for MATLAB Function xline()
The MATLAB function xline() creates and draws vertical lines at a specified point on the x-axis of a graph. It also provides the ability to place text labels and specify the format and attributes of the line color, width, linetype, etc. of the line being created. Next, we will look at each input argument for this function and explain the function each of them performs.
x: Specifies the coordinate of the “x” axis from which to draw the vertical line. This input accepts scalars and vectors to specify the coordinates.
LineSpec: specifies the style and color attributes of the line. The data type that LineSpec accepts is a character vector or string scalar.
Labels: enters the text labels we want to add to the vertical line. This input accepts strings and cell arrays of character vectors.
How to Create a Vertical Line with the xline() Function in MATLAB
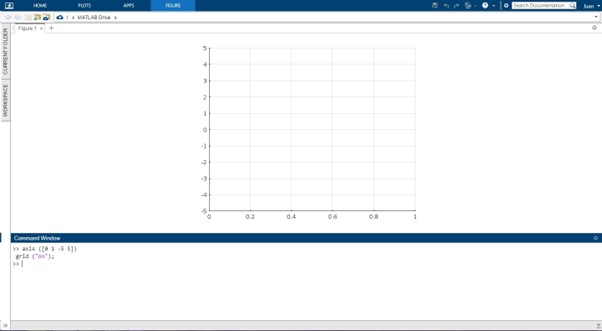
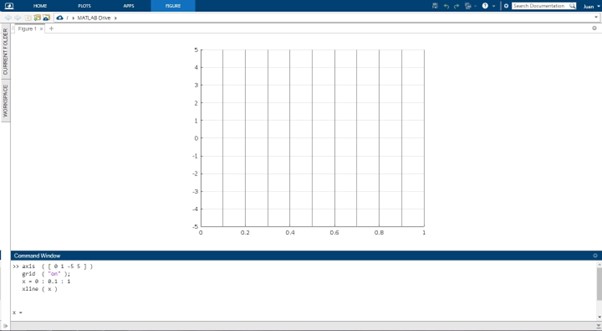
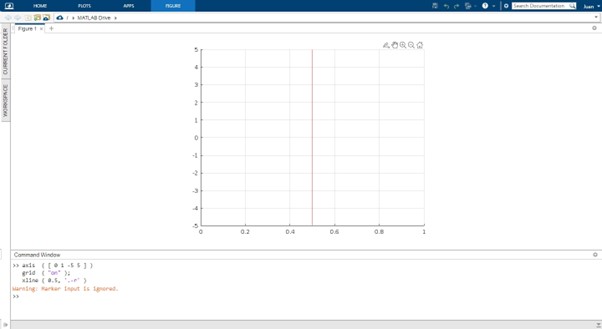
In this example, we will show you the simplest way to create a vertical line with MATLAB’s xline() function. For this, we will first create an empty axis and enable the grid with the following functions:

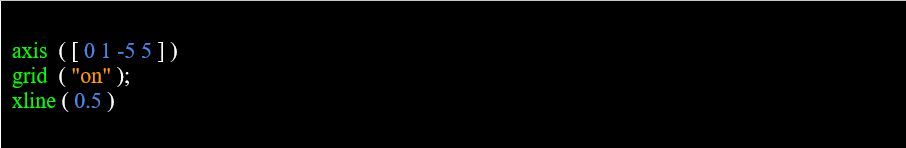
Now, we will draw a vertical line on this axis. To do this, we call the function xline() sending in “x” the coordinate of the x-axis on which we want to draw the line. In this case, in the middle of the axis, we enter in “x ” the value 0.5. In this example, we use only the “x” input argument, so the line style parameters take the default values. Thus, the line drawn by xline() will be continuous and black. Next, we see the full code. With these functions, we have created the following empty graph:
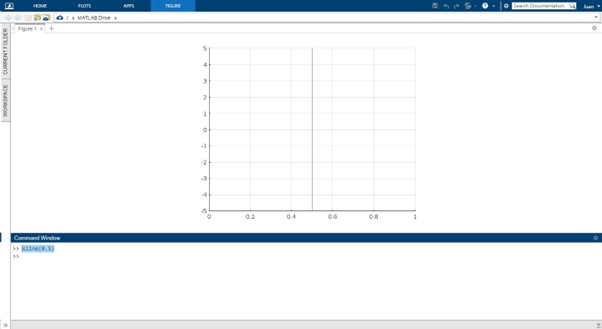
In the following figure we see the line drawn from the x-axis:
How to Create Multiple Vertical Lines with MATLAB xline() Function
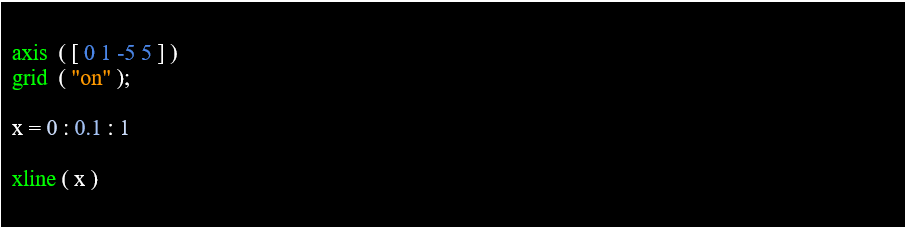
The input “x” to the MATLAB function xline() accepts scalars and vectors. So, it is possible to draw multiple lines by sending to “x” a vector with the coordinates of the multiple lines you want to draw. Next, we will see an example where we send a coordinate vector to draw10 equidistant vertical lines on a graph.
How to Set the Color Style and Linetype Using the LinSpec Input of the MATLAB Function xline()
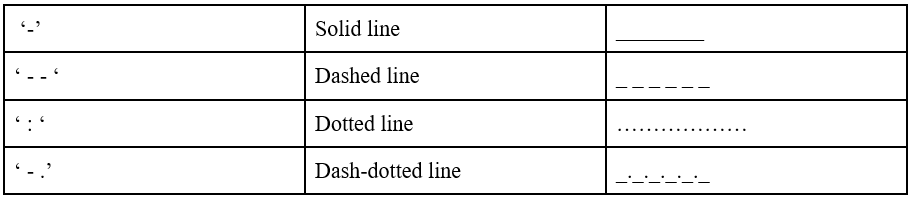
When we draw vertical lines with xline(), we have the option to specify the type and color of that line. This is done using the input “LineSpec”. In this example, we will see how to select these attributes. The syntax of the “LineSpec” input for selecting the line style and color is as follows:
Below is a table of the different line types and color options for the LineSpec.
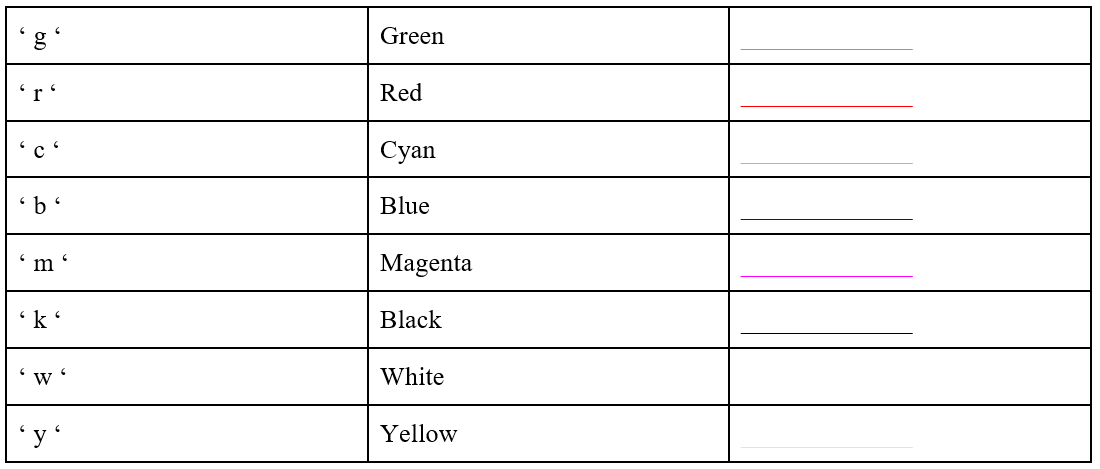
Next, we will see the color options offered by the xline() function.
Now, we use the “LineSpec” input to create a vertical line of the dash-dot line type in red color on the same graph we created in the previous example, this time at coordinate 0.2 of the x-axis. To do this, we send the following string in the “LineSpec” input to set these attributes:

Below we can see the code for this.
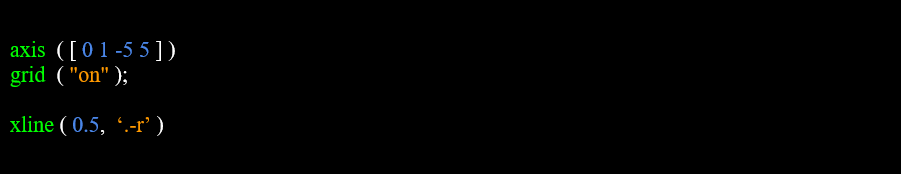
The following figure shows how the line style and line color attributes can be specified with the LinSpec input of the MATLAB function xline().
How to Add Text Labels to the Vertical Lines of a Plot with MATLAB’s xline() Function
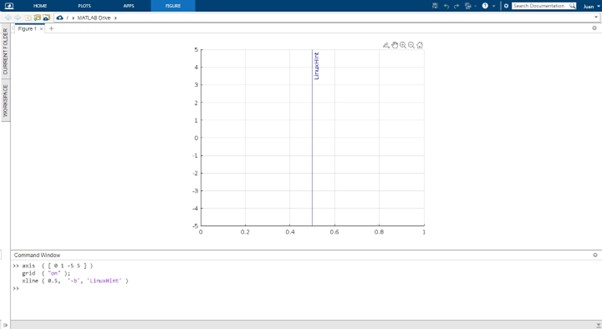
In this example, we show you how to add text labels to the vertical lines we create with the xline() function. These labels are sent as character strings at the time of the function call in the “label” input of xline(). We will now see an example of how we create a solid continuous blue line with the label “LinuxHint”. Next, we will see how the input arguments of the xline() function should be sent to create lines with text labels.

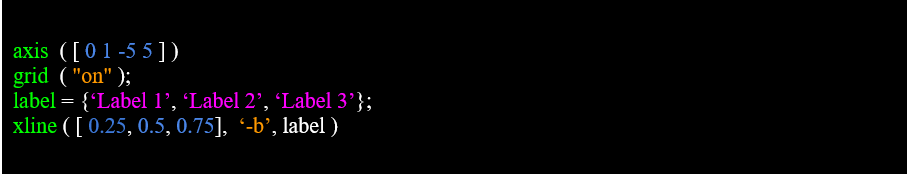
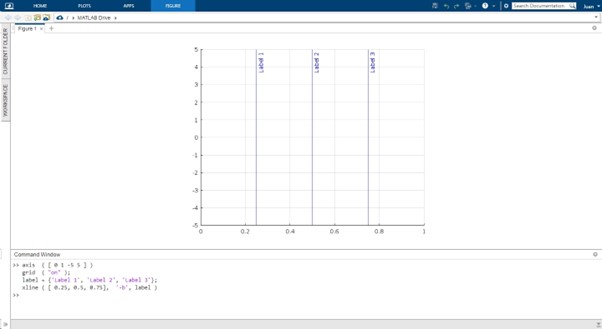
In cases where multiple lines of labels need to be created, we must first create a cell array of character vectors with each of these labels in the appropriate order and send this array to the “label” input of the xline() function as in the following example.
Conclusion
In this article, we showed you how to create and draw a vertical line on a graph using the MATLAB function xline(). We have described each of the input arguments in detail so that you can fully master this function. We have also included practical examples with image code snippets, showing how to set the style of the vertical lines and how to add text labels to them. We hope you found this MATLAB article helpful. See other Linux Hint articles for more tips and information.
Source: linuxhint.com