Pandas Summary Statistics
Summary statistics are numerical values that describe some aspects of a data set, such as its mean, median, and standard deviation. In Python, the “Pandas” module offers various methods to determine the summary statistics for variables in a Pandas DataFrame. One such method is the “df.describe()” method, which is used to determine the summary statistics for all numeric variables in a Pandas DataFrame.
This article will present you with a comprehensive tutorial on calculating Pandas summary statistics utilizing the below contents:
- How to Determine the Summary Statistics of Pandas?
- Using “DataFrame.describe()” Method to Retrieve the Summary Statistics For All Numeric Columns
- Using “DataFrame.describe()” Method to Retrieve the Summary Statistics For All Columns (Including Strings)
- Using “DataFrame.describe()” Method to Retrieve the Summary Statistics For Multiple Columns
- Using “groupby()” and “sum()” Method to Retrieve the Summary Statistics of Grouped Data
- Summary Statistics Functions
How to Determine the Summary Statistics of Pandas?
To determine the summary statistics of Pandas the “df.describe()” method is used in Python. This method determines the descriptive summary statistics by eliminating the Nan values from the particular data frame or Series. By default, this method determines the count, mean, std, min, and others on all numeric DataFrame columns.
Syntax
Parameters
In the above code:
- The “percentiles” parameter represents the list-like numbers between “0” and “1” that specify the percentiles to include in the output.
- The “include” parameter is a list of data types or a string that specifies which columns to include in the output.
- Similarly, the “exclude” parameter is used to specify whether to exclude specific columns from the output.
- Lastly, the “datetime_is_numeric” parameter specifies a Boolean value that determines how to treat datetime columns in the output.
Return Value
The “DataFrame.describe()” method retrieves the DataFrame or Series representing the summary statistics of the input DataFrame or Series.
Example 1: Using “DataFrame.describe()” Method to Retrieve the Summary Statistics For All Numeric Columns
In this example code, we first constructed DataFrame with numerous columns. Next, the “df.describe()” method is called on the “DataFrame” to retrieve the summary statistics:
df = pandas.DataFrame(({
'Name':["Anna","Joseph","Lily","Henry","Gloor"],
'Score_1' :[72,83,85,90,95],'Score_2' :[99,85,94,98,88],
'Score_3' :[93,96,85,82,92],'Attendance %' :[0.87,0.98,0.87,0.92,0.90]}))
print(df, '\n')
print(df.describe())
The above code shows the summary statistics of all numeric columns:

Example 2: Using “DataFrame.describe()” Method to Retrieve the Summary Statistics For All Columns (Including Strings)
We can also determine the summary statistics for all the other columns including the “object” types by using the “include=all” parameter value. In the below given code, this parameter value is passed to the “DataFrame.describe()” method and retrieves the summary statistics:
df = pandas.DataFrame(({
'Name':["Anna","Joseph","Lily","Henry","Gloor"],
'Score_1' :[72,83,85,90,95],'Score_2' :[99,85,94,98,88],
'Score_3' :[93,96,85,82,92],'Attendance %' :[0.87,0.98,0.87,0.92,0.90]}))
print(df, '\n')
print(df.describe(include='all'))
The summary statistics of the entire DataFrame including the object type column “Name” has been displayed:

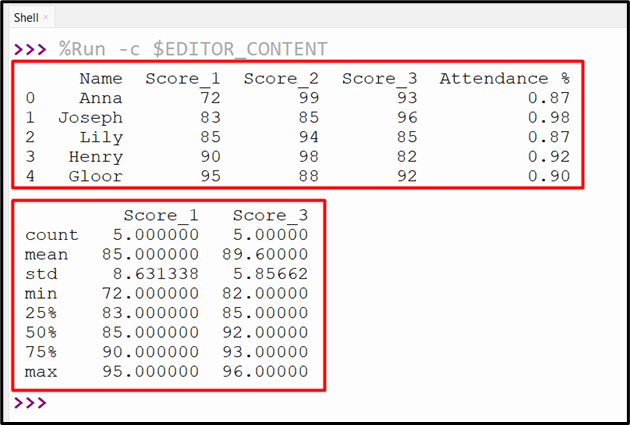
Example 3: Using “DataFrame.describe()” Method to Retrieve the Summary Statistics for Multiple Columns
In the code below, the “df.describe()” method takes the multiple columns and retrieves the summary statistics:
df = pandas.DataFrame(({
'Name':["Anna","Joseph","Lily","Henry","Gloor"],
'Score_1' :[72,83,85,90,95],'Score_2' :[99,85,94,98,88],
'Score_3' :[93,96,85,82,92],'Attendance %' :[0.87,0.98,0.87,0.92,0.90]}))
print(df, '\n')
print(df[['Score_1','Score_3']].describe(include='all'))
The following output shows the summary statistics:
Example 4: Using “groupby()” and “sum()” Method to Retrieve the Summary Statistics of Grouped Data
We can also break down the descriptive summary functions and apply each function to the specified DataFrame. In the below code, the “groupby()” method is utilized to group the data based on the particular “Name” column. Next the “sum()” is used along with the “groupby()” method to retrieve the total sum of all the columns:
df = pandas.DataFrame(({
'Name':["Anna","Joseph","Anna","Joseph","Anna"],
'Score_1' :[72,83,85,90,95],'Score_2' :[99,85,94,98,88],
'Score_3' :[93,96,85,82,92],'Attendance %' :[0.87,0.98,0.87,0.92,0.90]}))
print(df, '\n')
print(df.groupby('Name').sum())
The below snippet shows the summary statistics according to the group data using the specified summary function “sum()”:

Summary Statistics Functions
Here is the following summary statistics function supported in Pandas Series and DataFrame:
| Summary Function | DESCRIPTION |
| abs() | Calculated Absolute Value |
| max() | Maximum of Values |
| mean() | Mean of Column Values |
| cumsum() | Cumulative Pum |
| mode() | Mode of Values |
| std() | Standard Deviation of Values |
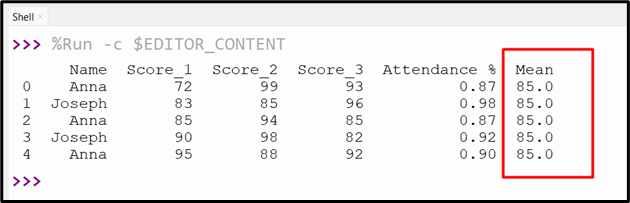
The other functions, such as count(), sum(), prod(), and median(), are also used to determine the summary statistics. Here is an example code that determines the mean of the specified column:
df = pandas.DataFrame(({
'Name':["Anna","Joseph","Anna","Joseph","Anna"],
'Score_1' :[72,83,85,90,95],'Score_2' :[99,85,94,98,88],
'Score_3' :[93,96,85,82,92],'Attendance %' :[0.87,0.98,0.87,0.92,0.90]}))
df['Mean']= df['Score_1'].mean()
print(df)
The above code execution retrieves the following output:
Conclusion
In Python, the “DataFrame.describe()” method is used to compute the descriptive summary statistics by not including the NaN values from DataFrame or Series. This method determines summary statistics using several summary functions by default, such as count, mean, std, max, etc. We can compute summary statistics on all numeric DataFrame and on object type columns using the “include=all” parameter. This guide covered an in-depth analysis of Panda’s summary statistics.
Source: linuxhint.com