Pandas Melt()
The dataframe’s columns, each of which can contain an integer, a floating-point number, or a string, are represented at the column level because it contains numerous indices, it, therefore, defaults to considering the nonvalue. Consequently, we melt the information using this column level. The variable name is a representation of the specific variable name that is used to melt columns. This adaptable typically comprises a scalar value and has the default value of non because it uses the variable used in that specific column to melt the dataframe.
The Syntax for the Melt() Function
![]()
“Value_vars” are representations of the existing unpaved columns. The majority of the columns are returned and not set as “id_var” if the column names are not indicated. A list tuple or ndarray can be used as these value parameters. All the sections that are used as identifier variables are represented by the variable “Id_vars”. The dataframe that must be allocated in Pandas is indicated by the frame.
Example # 1: Using the Melt Function, You Can Pass Several Columns as the value_vars Parameter
Using Pandas in Python, we may restructure the data into a more computer-friendly form to make table data processing simpler. The imperative “melt()” function requires to be executed. A dataframe is unpivoted from the large version to the usual format using “Pandas.melt()”. Initially, we create our dataframe. DataFrame is used to store information in a two-dimensional format. It is identical to a table in that data is stockpiled in rows and columns. Records are represented by rows and features are represented by columns.
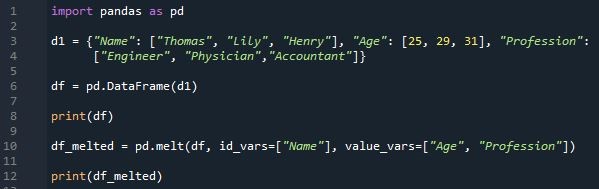
In this case, our data frame’s name is “d1” which has three columns. “Name” is the first column in our data frame and additionally included is a list of some names: “Thomas”, “Lily” and “Henry”. The second column we have is “Age” which contains “25”, “29” and “31”. And in the third column, “Profession”, we have “Engineer”, “Physician” and “Accountant”. Using “Pd.DataFrame” we will display the dataframe on the screen.
Now, let’s add the “melt()” function to our application. The “melt()” function’s “id var” and “value var” parameters were used. To use a column or columns as identifier variables, use “id _var” and the “value_var” which is the second parameter used in this example to define where the content would be melted and stored in the additional lines. Here, we use an “int_var” in a single column and a “value_var” in numerous columns. We use “value_var” in the columns “Age” and “Profession” and “id_var” in the column “Name”. “pd.melt” is used to generate the dataframe and “print (df_melted)” will display the dataframe on the screen.
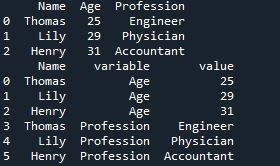
Two dataframes are visible in the program’s output image. Using the “pd.dataframe” function, we generated the first data frame in which we have three columns “Name”, “Age” and “Profession”. By applying the parameters “id_var” and “value _var” to the “pd.melt()” method, the second dataframe is generated. “id_var” is applied in a single column which is “Name”. It signifies that the column will be shown exactly as it is with its values and the “value_var” is used in two columns “Age” and “Profession”. It creates two columns in the dataframe, one is “variable” and the other is “value” in the value column, the column name is displayed.
A crucial tool that chooses specific rows and columns of data from a DataFrame is called a Pandas Index. Its job is to set up the data for quick access and organization. It is also described as a subgroup. The individual value of the index is referred to as a label and the values are written in bold type in the index. The initial dataframe’s index size is “3,” which ranges from “0 to 1,” and when the parameters are applied, the index size is “6” which ranges from “0 to 5”.
Example 2: Using the Melt Function, You Can Pass Several Columns as the int_vars Parameter
See what happens when you specify more than one column for the id_vars option. Similar to the last example, this one applies “id_var” to multiple columns while “value_var” is applied to a single column. In the previous program, “value_var” was applied to multiple columns while “id_var” was applied to a single column.
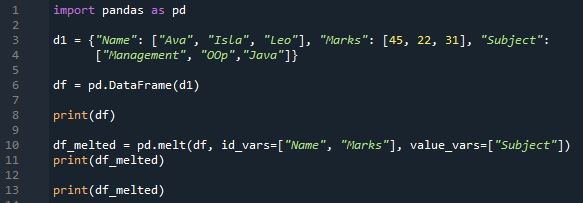
The very first thing we do is construct a three-column dataframe. The name of the column is “Name”, “Marks” and “Subject”. The names which are in the first column are “Ava”, “Isla” and “Leo”. In the second column, we have the list of marks “45”, “22”, and “31”. For the third column, we have the name of the subject including “Management”, “OOP”, and “Java”. Now, “pd.dataframe” will generate the dataframe and “print(df)” will display the dataframe on the screen.
Let’s now incorporate the “melt()” method into our code. The “id_var” and “value _var” arguments of the “melt()” function were utilized. The “id_var” is used in two columns. “Name” and “Marks” and “value_var is used in one column “Subject”. To create the new dataframe utilizing the information from the old dataframe, use “pd.melt”. Now, the dataframe will be shown on the screen by “print (df melted)”.
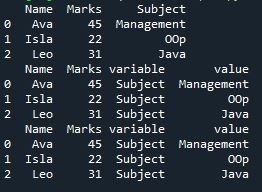
The result of the “melt()” function with its two arguments which are “id_var” and “value_var” is displayed in the output. By applying “id_var” on the two columns “Name” and “Marks”, it will display its values as it is and as we applied “value_var” to the column “Subject “. Then, it is divided into these two columns “variable” and “value”. In the column “variable”, it shows the column name “Subject” and in the column “value” it shows the values of the column “subject”. The index is “3” in magnitude, varying from “0 to 2”.
Conclusion
The “melt()” method in Pandas is a versatile way to modify the Pandas dataframe. We learned how to utilize Pandas’ melt() function to convert a big dataframe into a long, dataframe using a straightforward use case. You should constantly restructure a section of the parts in our material while keeping at least one segment in place as indicators. The “Melt()” function in Pandas is a fantastic tool for modifying data. If you manage a lot of diverse economic and money-related information and require it in a more database-friendly lengthy shape, it is especially helpful.
Source: linuxhint.com