Pandas Describe
The pandas describe() function allows you to get the statistical summary of the data within your Pandas DataFrame. The function returns statistical information on the data, including statistical mean, standard deviation, min and max values, etc.
Function Syntax
The function syntax is as shown below:
|
1
|
DataFrame.describe(percentiles=None, include=None, exclude=None, datetime_is_numeric=False)
|
Function Parameters
The function accepts the following parameters:
- percentiles – allows you to get a specific percentile of the data within a DataFrame. The percentile value ranges from 0 to 1.
- include – specifies a list of data types to have in the result set with accepted values, including None and all.
- exclude – list of data types to exclude in the result set.
- datetime_is_numeric – allows the function to treat datetime objects as numeric.
Function Return Value
The function returns a DataFrame with each row holding the type of the statistical property of the columns.
Example
Consider the example below that illustrates the primary usage of the describe() function in Pandas
|
1
2 3 4 5 6 |
import pandas as pd
df = pd.DataFrame({ "first_name": ['Fracis', 'Bernice', 'Debra'], "last_name": ['Barton', 'Wyche', 'Wade']}, index=[1,2,3]) df.describe() |
In the example above, we start by importing the pandas library. We then create a simple DataFrame and call the describe() method.
The above code should return a basic info summary about the DataFrame. An example output is as shown
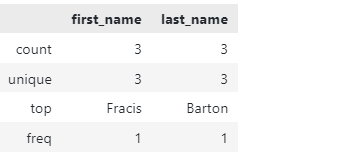
Note how the function returns basic statistical information such as the count of values, how many are unique, the top value, etc.
Example #2
Consider the example below that returns the statistical summary of a Pandas Series:
|
1
2 |
s = pd.Series([10,20,30])
s.describe() |
In this example, the function should return an output as shown:

In this case, the function returns basic summary info such as the standard mean, 25th, 50th, and 75th percentiles, and the maximum value in the series.
Example #3
To describe a specific column in a Pandas DataFrame, use the syntax as shown below:
|
1
|
DataFrame.column_name.describe()
|
Example #4
To exclude a specific data type from the result, use the syntax shown:
|
1
|
df.describe(exclude=[np.datatype])
|
Example #5
To describe all the columns in a DataFrame, regardless of the data type, run the code:
|
1
|
df.describe(include='all')
|
Conclusion
In this article, we discussed how to use the describe() function in Pandas.
Source: linuxhint.com