Pandas Crosstab() Function
A cross-tabulation or contingency table is used to provide a way to analyze the relationship between two or more variables. The data analysis or manipulation module named “Pandas” provides various modules and methods for different operations, including the creation of cross-tabulation. The “pandas.crosstab()” method of the “pandas” module is used to achieve this operation in Python.
This Python write-up will present you with a complete overview of the “pandas.crosstab()” function using several examples.
What is the Python Pandas Crosstab() Function?
In Python, the “pandas.crosstab()” function of the “pandas” module is used to compute/determine the simple cross-tabulation of single or multiple factors.
Syntax
Parameters
In the above syntax:
- The “index” and “columns” parameters specify the values for the rows and columns to group by.
- The “values” parameter indicates the values of the array to aggregate according to the factors.
- The “rownames” and “colnames” parameters provide the name of the row and column index.
- The “aggfunc=” parameter indicates the aggregation function to be used when aggregating the value parameter.
- The “margins” parameter is used to insert a row and column, including the grand total of the crosstab.
- The “margins_name” parameter indicates the name of the row and column specifying the grand total of the crosstab.
- The “dropna” and “normalize” parameters are optional and can be used for specified purposes.
Return Value
The “pandas.crosstab()” method retrieves the DataFrame with cross-tabulation of data.
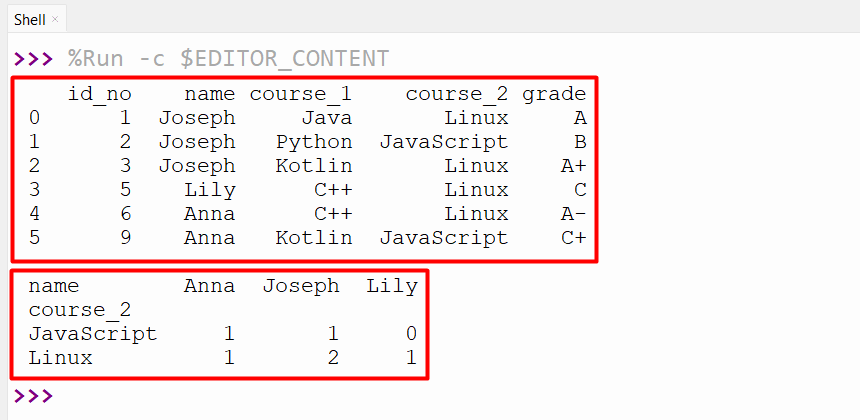
Example 1: Creating Crosstab Table Using the “pandas.crosstab()” Function
The below code is employed to construct/create a crosstab table using the “pandas.crosstab()” function. Here, the DataFrame is created with multiple columns. The “pandas.crosstab()” function takes the “course” column as the “x-axis” and the “name” column as the “y-axis” to create the cross-tabulation table:
df = pandas.DataFrame([[1,"Joseph","Java","Linux",'A'],
[2,"Joseph","Python","JavaScript",'B'],
[3,"Joseph","Kotlin","Linux",'A+'],
[5,"Lily","C++","Linux",'C'],
[6,"Anna","C++","Linux",'A-'],
[9,"Anna","Kotlin","JavaScript",'C+']],columns=["id_no","name","course_1","course_2","grade"])
print(df,"\n")
print(pandas.crosstab(df.course_2,df.name))
The below output retrieves the table that summarizes the distributions of the “course_2” columns based on the “name” column value:
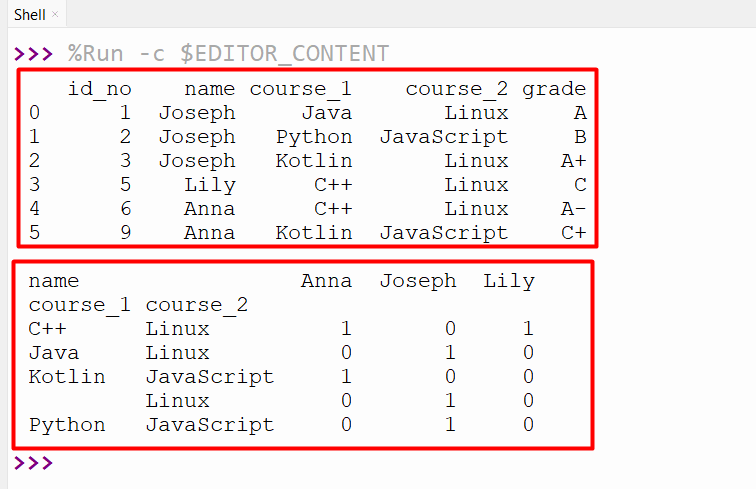
Example 2: Creating Crosstab Table With Multiple Factors Using the “pandas.crosstab()” Function
Here, the “pandas.crosstab()” function is used to create the table that computes the cross-tabulation of multiple column values based on the other column. This function sets the “course_1” and “course_2” columns as horizontal “x-axis” and the “name” column as vertical “y-axis”:
df = pandas.DataFrame([[1,"Joseph","Java","Linux",'A'],
[2,"Joseph","Python","JavaScript",'B'],
[3,"Joseph","Kotlin","Linux",'A+'],
[5,"Lily","C++","Linux",'C'],
[6,"Anna","C++","Linux",'A-'],
[9,"Anna","Kotlin","JavaScript",'C+']],columns=["id_no","name","course_1","course_2","grade"])
print(df,"\n")
print(pandas.crosstab([df.course_1, df.course_2],df.name))
The frequency table of the specified factors has been calculated and displayed in the output:
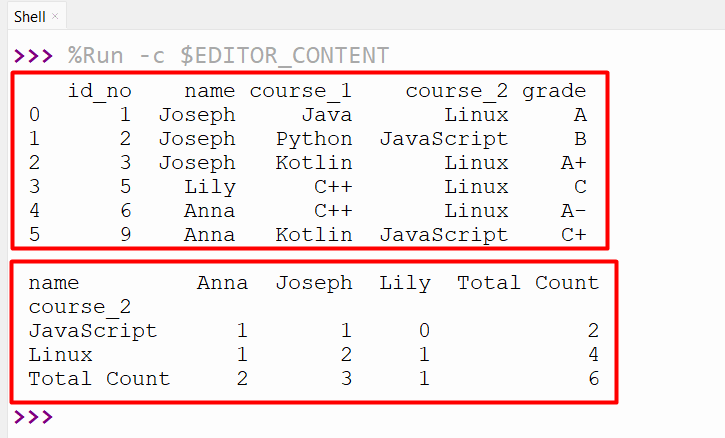
Example 3: Creating Crosstab Table With Row and Column Margins Using the “pandas.crosstab()” Function
To add the row or column margins, the “margins=True” parameter with the “margins_name” parameter is passed to the “pandas.crosstab()” function. This function retrieves the crosstab table by including the total count of the row and column of the DataFrame:
df = pandas.DataFrame([[1,"Joseph","Java","Linux",'A'],
[2,"Joseph","Python","JavaScript",'B'],
[3,"Joseph","Kotlin","Linux",'A+'],
[5,"Lily","C++","Linux",'C'],
[6,"Anna","C++","Linux",'A-'],
[9,"Anna","Kotlin","JavaScript",'C+']],columns=["id_no","name","course_1","course_2","grade"])
print(df,"\n")
print(pandas.crosstab(df.course_2,df.name,margins=True,margins_name="Total Count"))
The following snippet displayed the crosstab table with row and margin values:
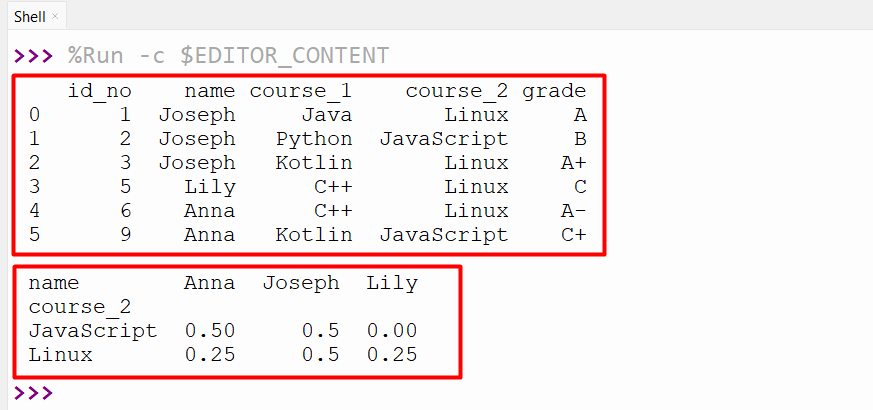
Example 4: Creating and Normalizing Crosstab Table Using the “pandas.crosstab()” Function
We can also normalize the crosstab table using the “normalized” parameter of the “pandas.crosstab()” function. The “normalize” value is set to “index” to normalize the table by dividing the value by the total count:
df = pandas.DataFrame([[1,"Joseph","Java","Linux",'A'],
[2,"Joseph","Python","JavaScript",'B'],
[3,"Joseph","Kotlin","Linux",'A+'],
[5,"Lily","C++","Linux",'C'],
[6,"Anna","C++","Linux",'A-'],
[9,"Anna","Kotlin","JavaScript",'C+']],columns=["id_no","name","course_1","course_2","grade"])
print(df,"\n")
print(pandas.crosstab(df.course_2,df.name,normalize='index'))
The normalized cross table has been retrieved successfully in the below output:
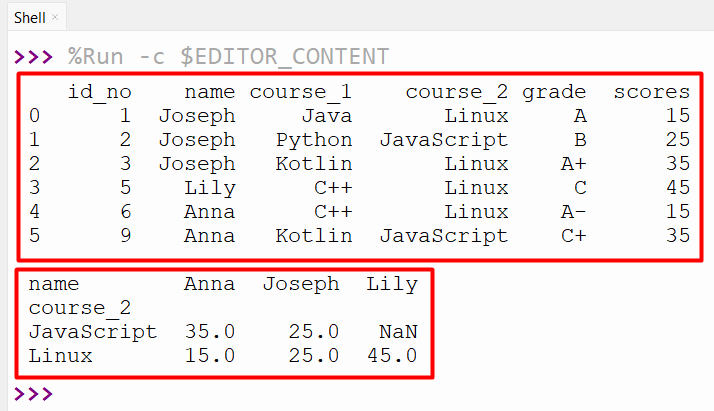
Example 5: Creating Crosstab Table By Utilizing the “aggfunc=” of the “pandas.crosstab()” Function
The “aggfunc=” parameter is used to apply the various aggregate functions on the crosstable. The “numpy.mean” value is passed to the “afffunc=” parameter of the “pandas.crosstab()” to create the table with the mean value for each specified factor. Here, in our case, the “df.scores” column value is assigned to the values parameter, which indicates that the “numpy.mean” function is applied to the “scores” columns:
import numpy
df = pandas.DataFrame([[1,"Joseph","Java","Linux",'A', 15],
[2,"Joseph","Python","JavaScript",'B', 25],
[3,"Joseph","Kotlin","Linux",'A+', 35],
[5,"Lily","C++","Linux",'C', 45],
[6,"Anna","C++","Linux",'A-', 15],
[9,"Anna","Kotlin","JavaScript",'C+', 35]],columns=["id_no","name","course_1","course_2","grade", "scores"])
print(df,"\n")
z1 = pandas.crosstab(df.course_2,df.name, values=df.scores, aggfunc=numpy.mean)
print(z1)
The retrieved cross table contains the mean value of the score column for the specified combination “course_2” and “name”:
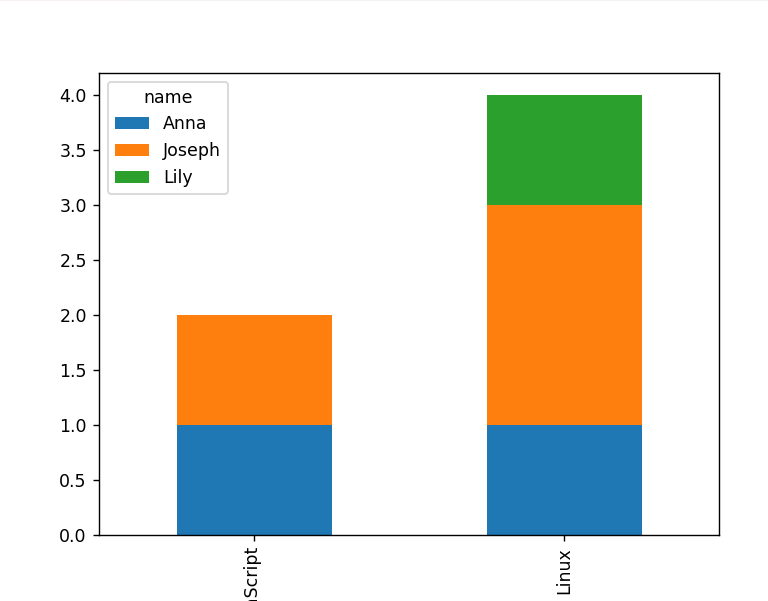
Example 6: Creating and Visualizing the Crosstab Table Using the “pandas.crosstab()” Function
We can also visualize the crosstab table by using the matplotlib module. The stacked bar plot is plotted using the “plot()” function and displayed to the console via the “plt.show()” function:
import pandas
df = pandas.DataFrame([[1,"Joseph","Java","Linux",'A'],
[2,"Joseph","Python","JavaScript",'B'],
[3,"Joseph","Kotlin","Linux",'A+'],
[5,"Lily","C++","Linux",'C'],
[6,"Anna","C++","Linux",'A-'],
[9,"Anna","Kotlin","JavaScript",'C+']],columns=["id_no","name","course_1","course_2","grade"])
print(df,"\n")
z1 = pandas.crosstab(df.course_2,df.name)
print(z1)
z1.plot(kind='bar', stacked=True)
plt.show()
The output snippet verified that the crosstable has been visualized as a bar chart:
Conclusion
The “pandas.crosstab()” function of the “pandas” module determines the simple cross-tabulation of single or multiple factors. This method retrieves the DataFrame that displays the variable’s frequency distributions by accepting two or more Series or arrays. This blog presented a detailed guide on the “pandas.crosstab()” method via multiple examples.
Source: linuxhint.com