Pandas Columns
How to Add Columns or Values to a Column in Pandas
Columns can be added to a DataFrame using the several methods. In the following example, we use the apply() and insert() functions to add columns to our DataFrame.
Example 1: Add Column to DataFrame Using Apply() Function
You can add multiple columns to a DataFrame by using the pandas.DataFrame.assign() method. First, we create a sample DataFrame using the pd.DataFrame() function with some rows and columns. The “pandas” library is imported first to create the Pandas DataFrame.
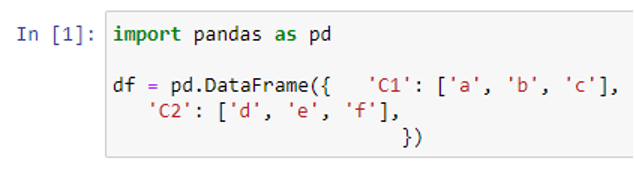
We created the “df” dataframe by passing a dictionary with two keys – “C1” and ”C2” – with values [“a”, “b”, “c”] and [“d”, “e”, “f”] respectively. By passing the dictionary in pd.DataFrame, the keys become the label of columns and the values in the list become the data of each cell in columns of the DataFrame.
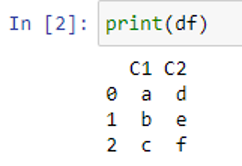
As can be seen, we created a DataFrame with two columns now. Using the assign() function, we add further columns or columns to our “df” DataFrame.
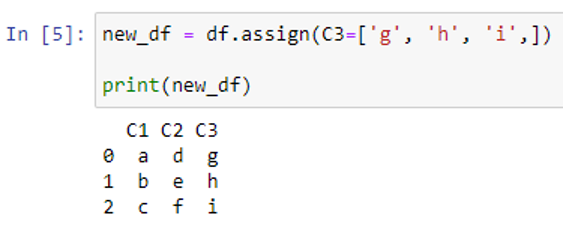
The function gives a new DataFrame “new_df” that contains both the additional (newly added “C3”) column and all of the old columns (“C1” and “C2”) as a result. Keep in mind that if any current columns are reassigned, all of them will be overwritten.
Example 2: Add Column to DataFrame Using Insert() Function
The “DataFrame.insert()” method can also be used to add columns to a DataFrame. Let’s first create a DataFrame with some rows and columns.
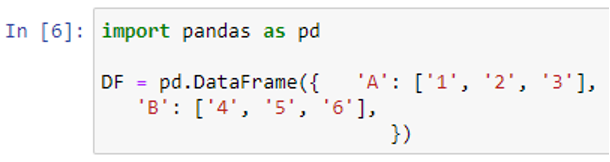
To display our “DF” DataFrame, the print() function is used.
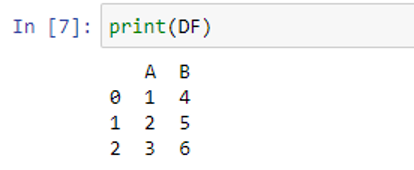
Our DataFrame has two rows – A and B – with values [“1”, “2”, “3”] and [“4”, “5”, “6”] respectively. Now, we use the insert() method to add another column in the “DF” DataFrame.

Before using the insert() function, we created a list having values [“7”, “8”, “9”]. The DataFrame’s indexing of columns begins at zero. When we applied the insert() function with the “DF” DataFrame, we specified the index 1 to place the new column “C”. We also passed the “values” list in the parameters of the insert() function to store the values of column “C”.
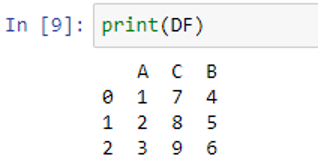
You can notice that our new column is added at the 2nd column location between “A” and “B” because we specified the index “1” in the parameters of the insert() function.
How to Select Columns in Pandas
Columns can be selected by their index positions, labels, or datatypes. We will see how to select the specific and multiple columns in the following examples.
Example 1: Select a Specific Column Using the Column Names/Labels
We create a sample DataFrame to show you how you can select a specific column of the DataFrame.
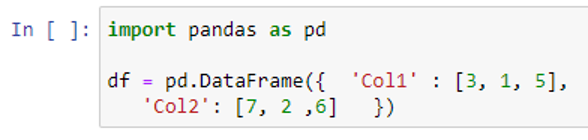
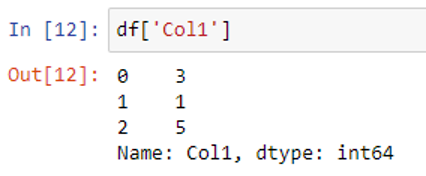
We created the DataFrame with columns “Col1” and “Col2”. The simplest way to get a specific dataframe column is to write the column name as a string with quotes in brackets [].
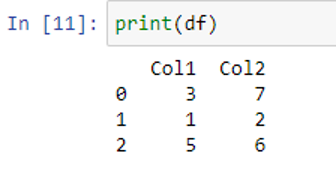
In the given DataFrame, we have two numeric columns – “Col1” and “Col2” – having the values (3, 1, 5) and (7, 2, 6) respectively.
By using a list with multiple names of the DataFrame columns inside the “[]” brackets, you can select multiple columns.
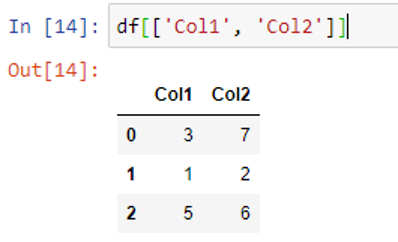
As can be seen, we passed a list containing both column names “Col1” and “Col2” in the brackets.
Example 2: Select a Specific Column by Their Datatype
We create a DataFrame having columns with different datatypes.
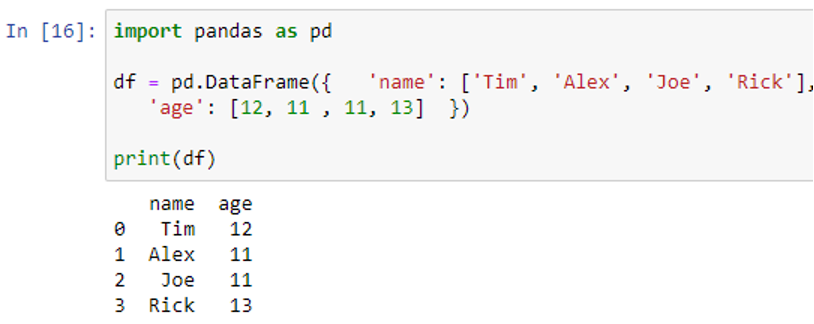
The “name” column stores the names of persons (“Tim”, “Alex”, “Joe”, “Rick”). Whereas the “age” column stores the ages of persons (12, 11, 11, 13). Let’s check the datatypes of our DataFrame columns by using the “dtypes” attribute.
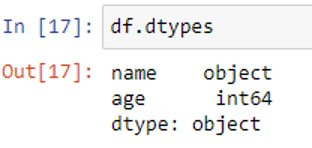
The datatype of the “name” column is “object” and “int64” is the datatype of the “age” column. Now, we select the columns by their datatype using the “loc[]” function.
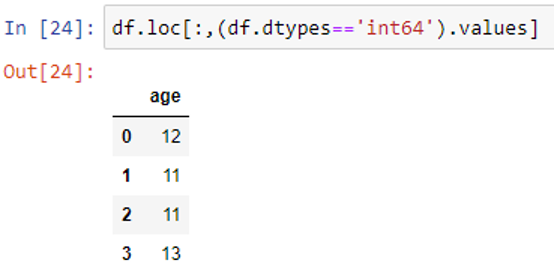
Inside the df.loc[] function, we specified the dtypes==’int64’. The values are returned where the datatype is ‘int64’ using the “.values” attribute with df.loc[:,(df.dtypes==’int64′) function.
Example 3: Select Multiple Columns by Their Indexes
We create a new sample DataFrame to show you how to select multiple or all columns of the DataFrame using the “iloc[]” method.
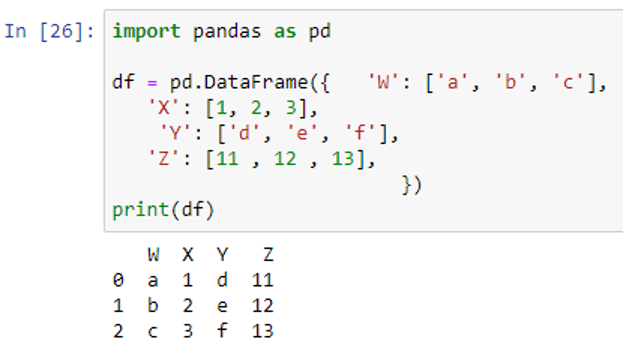
Since we created our DataFrame, now we use the iloc[] method to select multiple columns from our DataFrame. When a single column is selected, the iloc[] method returns a Series object. When more than 1 column is selected, a Pandas DataFrame is returned.

We specified the index range of columns from 0 to 3. Note that the column at index 3 is not part of the group. Only the columns from index 0 to 2 are selected.
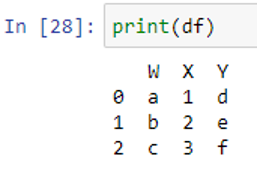
As can be seen, the columns “W”, “X”, and “Y” are selected by specifying the range 0:3.
How to Alter the Column Names and Column Values
In the following example, we will change the column names using the rename() function and the change the values using the replace() function.
Example 1: Change the Column Label Using the Rename() Function
First, we create a DataFrame having one or more columns.
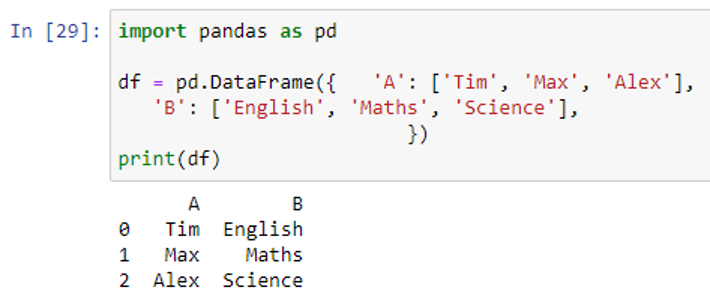
Once the DataFrame is created, we can rename its column by using the Pandas rename() function. Inside the rename() function, we use a dictionary like {original_label: new_label}. And we specify the current label and the new label (which we want to add).
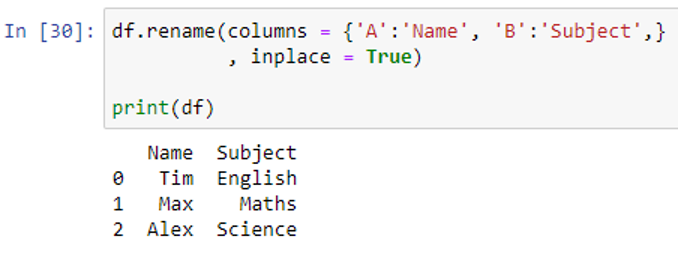
As you can observe, we changed the name of column “A” to “Name” and the name of column “B” to “Subject”.
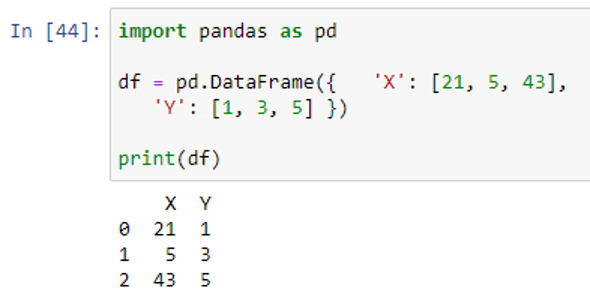
Example 2: Change the Column Values Using the Replace() Function
We create a DataFrame having the number of columns storing values. Then, we modify the values of columns using the replace() function.
Since we created our DataFrame, let’s now change the values of its column using the replace() function. The replace() method swaps the value in the DataFrame column with the new specified value.
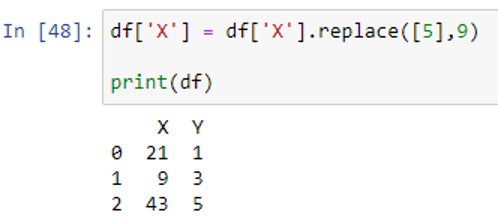
The replace() function replaced the value of column “X” from column “5” to 9.
How to Remove the Pandas Columns
The DataFrame columns can be deleted using the drop() and del method in Pandas.
Example: Deleting a Column from a Pandas DataFrame
Let’s create a DataFrame first from which we will delete the specific columns using drop() and del methods.
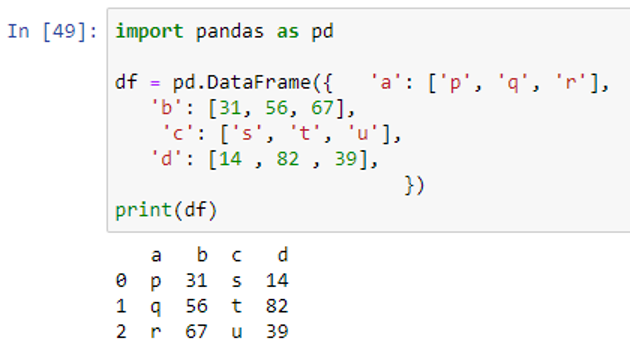
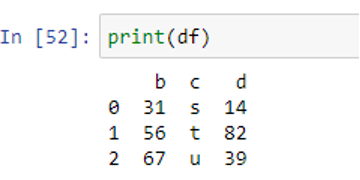
We have a DataFrame “df” with 4 columns (“a”, “b”, “c”, “d”). The DataFrame’s drop() method deletes the rows or columns based on corresponding axes and specified column(label) names. Let’s delete column “a” using the drop() function.
![]()
The axis=1 denotes that we are removing the column, not the row.
The drop() function successfully removed the column “a”. Now, let’s use the “del” method on column “d”.
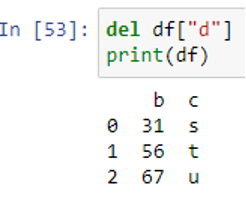
The column “d” is removed from the DataFrame using the “del” method.
Conclusion
In this tutorial, we discussed what are columns in the Pandas DataFrame. We used the different functions to add, modify, and delete columns from our DataFrame. This tutorial is designed to teach the different operations that you can perform on a DataFrame’s column in Pandas. We implemented multiple examples to teach you how you can add columns or values in a column, how to select columns, how to change column names and column values, and how to delete the column from a Pandas DataFrame.

Source: linuxhint.com