Pandas Average
How to Use Pandas Average Function?
We must first comprehend the syntax before looking at how to use the mean() method to calculate the average. Depending on the kind of object you’re using, the pandas mean method will determine its syntax. Mean() can be applied to the dataframe, series, and individual columns of the dataframe.
Syntax to Use the mean() function for Dataframes
Following is the syntax to use the mean() function on a dataframe.
Syntax: df.mean( )
You need to type your dataframe name followed by.mean() to invoke the method when using mean() on an entire dataframe. The mean(), by default, tries to operate on every column when applied to a whole dataframe. However, in actuality, the output usually just consists of the means of numerical variables. You can also use a few additional optional parameters to slightly alter the outcome we get by using the mean() function.
Syntax to Use the mean() function for Pandas Series
When applying the mean()technique to a Series, the syntax is quite similar to that of a dataframe.
Syntax: series.mean( )
There are some arguments you can use to alter the results when using mean() on a Series, just like with dataframes.
Syntax to Use the mean() function for Individual Columns in the Dataframe
Since dataframe columns are pandas series objects, applying Pandas mean on a column requires two steps: using dot syntax to retrieve the specified column and then calling the mean() function.
Syntax: df.column.mean( )
For instance, you would use the code “df.column.mean()” if your dataframe is named df and the column you wish to operate on is called “column”. It will then calculate the mean for just that one column.
Parameters
axis: This is a reference to the axis for the function that will be used.
skipna: It doesn’t include any null values in the computation of the result.
level: If the axis is a MultiIndex, it counts along with that level and collapses into a Series.
Numeric_only:
Only int, float, and boolean columns are present. If none, it will try using everything before using simply numerical information. Not used for the Series.
Returns: If the level is specified, it gives the mean of the DataFrame or series.
Now, we have understood the syntax, so let’s proceed further to implement it in the examples below.
Example # 1: Find the Dataframe Column’s Average Value
First, the pandas and numpy modules will be imported then we will create our dataframe. Let’s create a sample dataframe having the data of employees of a company.

We have produced a dataframe by utilizing the pd.Dataframe( ) function and stored the record of 10 employees in the df dataframe by passing parameters inside the pd.Dataframe( ) i.e. emp, columns and index. The print() function is used to visualize our dataframe.
Let’s compute the mean of a single column in a dataframe. Here, we will find the mean/average of the age variable.
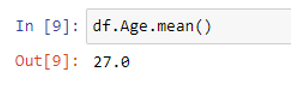
The age variable, in this case, is being retrieved using “dot syntax.” We’re using the code df.age to accomplish that. But just after that, we compute the mean by using .mean(). This essentially extracts the age column from the df dataframe and computes the mean of that column.
Example # 2: Find the Average of the Entire Dataframe
Let’s next apply the mean() method to an entire df dataframe, which we have created in example # 1 as follows:

The above script will calculate the mean of all numeric columns in our df dataframe.
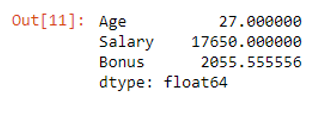
The mean() method calculated the mean of each numerical variable when mean() was called on the whole dataframe. Therefore, it calculated the average Age, Salary, and Bonus of the df dataframe. Thus, using the mean() method on the entire dataframe, the average Age is 27.000000, the average Salary is 17650.000000, and the average Bonus is 2055.555556.
Example # 3: Find the Average of the Dataframe, Including Missing Values
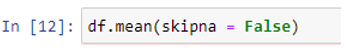
Have you noticed that there are the same missing values in our df dataframe? The skipna option of the mean() is always configured as skipna = True by default. Pandas mean() ignores missing values if the skipna option is set to True. By specifying skipna = False, we can disable that.
The mean of columns having missing values will be NaN.
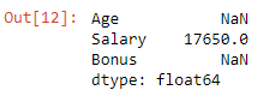
Age and Bonus column means are both NaN. This is due to missing values in the Age and Bonus variables that have now been included in the output. You could choose to skip over these values when a variable has them by setting skipna = True. Alternatively, you would like to use the Pandas fillna method to fill in the missing values.
Example # 4: Find the Average Grouped by a Categorical Variable
Here, the mean salary is calculated by Bonus. This involved some steps:
-
- group the data by Bonus using groupby()
- retrieve the Salary variable
- call the mean() function
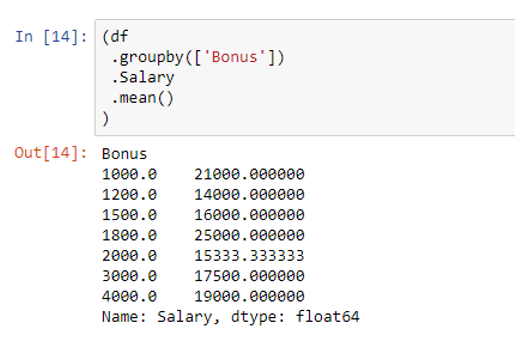
As you can see, using .groupby([bonus]) has converted the values of Bonus as a group where the data value was occurring more than once (2000 was occurring 3 times). The code df.groupby([‘Bonus’]).Salary.mean() calculated the average of Salary values against the grouped values of the Bonus variable.
Example # 5: Calculate the Conditional Mean for the Categorical Variable
The same df dataframe will be used in this example also. The following code demonstrates how to determine the average for the “Salary” column for just the rows of the DataFrame when the “Bonus” column has a value larger than 1800.
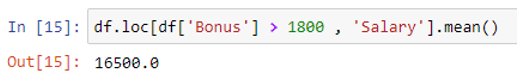
A set of rows and columns can be accessed using the df. loc[] property by labels. In the above code, you can see that the average salary for rows with bonuses greater than 1800 is shown in the salary column. It means the average Salary of those individuals/employees whose Bonus is greater than 1800 is 16500.0.
Conclusion
To determine the average value of a Pandas Series or data frame, we utilize the mean() method. You should now have a better understanding of the working of the pandas Mean method after going through this article. To determine the average value of a Pandas dataframe or Series, the mean() method is used. With the examples, we tried to teach you how to find the average of a column in a dataframe, find the average grouped by a categorical variable, and how find conditional mean using the mean() function.
Source: linuxhint.com