Pandas Agg Count
Aggregation is the process of applying multiple functions to a data group and producing a single value for each group. The “Pandas” library supported various methods to execute aggregation operations on DataFrames, such as sum, mean, count, size, etc. The “groupby()” method of the “pandas” module is used to group data by one or more columns, and the agg method, such as “count” in our case, is used to count the number of values in a column for each grouped data.
This Python tutorial will present a detailed guide on how to count the rows of each Pandas DataFrame group via the below content:
- Using “groupby()” and “count()” Method
- Using “groupby()” and “size()” Method
- Using “agg()” or “aggregate()” Function
- Using “DataFrame.transform()”
Getting Count for Each Group Using “groupby()” and “count()” Method
To count the rows of each specified Pandas DataFrame group, the “groupby()” and “count()” methods are used in Python. The below code demonstrates the working of these functions:
data1 = ({'Name':["Anna", "Lily", "Henry", "Joseph", "Anna", "Joseph"],'Age' :[45, 23, 34, 39, 15, 32],'Height':[4.5, 6.3, 5.7, 2.8, 3.1, 3.0],'Salary':['$500', '$450', '$120', '$220', '$422', '$540']})
df = pandas.DataFrame(data1)
print(df,'\n')
df2 = df.groupby(['Name'])['Name'].count()
print(df2)
In the above code:
- The “pandas” module is imported.
- The “DataFrame” is created by utilizing the “pandas.DataFrame()” method.
- The “df.groupby()” method takes the column name “Name” and groups the data.
- After grouping the data, the “count()” method is applied to the group and shows the count value for each group.
Output
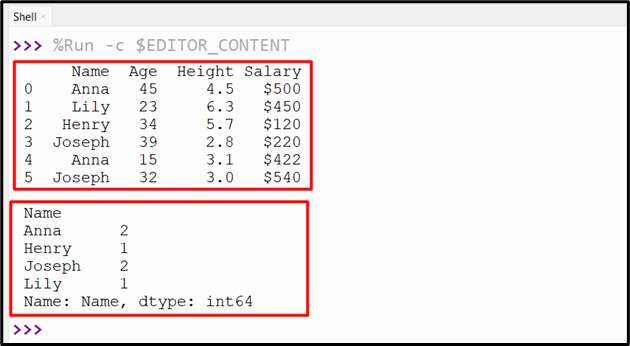
The count for each group has been retrieved.
We can also pass the multiple columns or list of columns to the “df.groupby()” method and apply the count() method to calculate the count through each group. Here is an example code:
data1 = ({'Name':["Anna", "Lily", "Henry", "Joseph", "Anna", "Joseph"],'Age' :[45, 23, 34, 39, 45, 32],'Height':[4.5, 6.3, 5.7, 2.8, 3.1, 3.0],'Salary':['$500', '$450', '$120', '$220', '$422', '$540']})
df = pandas.DataFrame(data1)
print(df,'\n')
df2 = df.groupby(['Name', 'Age'])['Height'].count()
print(df2)
In the above code:
- The “df.groupby()” method takes the list of columns as an argument and groups the data according to that column’s value.
- After grouping, the “count()” method is applied to it and determines the count value for each group.
Output
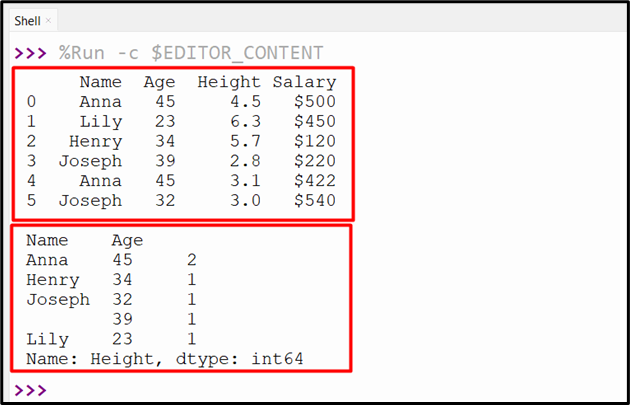
The count for each group has been determined.
Getting Count for Each Group Using “groupby()” and “size()” Method
The “size()” method can also be used instead of the “count()” method to determine the rows count value for each group. To get a better understanding of this, utilize the below code:
data1 = ({'Name':["Anna", "Lily", "Henry", "Joseph", "Anna", "Joseph"],'Age' :[45, 23, 34, 39, 45, 32],'Height':[4.5, 6.3, 5.7, 2.8, 3.1, 3.0],'Salary':['$500', '$450', '$120', '$220', '$422', '$540']})
df = pandas.DataFrame(data1)
print(df,'\n')
df2 = df.groupby(['Name', 'Age'])['Height'].size()
print(df2)
In the above code:
- The “df.groupby()” method is used along with the “size()” method to group data on multiple columns and counts all the values of each row of the particular group.
Output

The count of the specified group has been determined.
Getting Count for Each Group Using “agg()” or “aggregate()” Function
The “agg()” function is used along with the “df.groupby()” function to count the data of each DataFrame group. For example, let’s take a look at the following example:
data1 = ({'Name':["Anna", "Lily", "Henry", "Joseph", "Anna", "Joseph"],'Age' :[45, 23, 34, 39, 45, 32],'Height':[4.5, 6.3, 5.7, 2.8, 3.1, 3.0],'Salary':['$500', '$450', '$120', '$220', '$422', '$540']})
df = pandas.DataFrame(data1)
print(df,'\n')
df2 = df.groupby(['Name', 'Age'])['Height'].agg('count').reset_index()
print(df2)
In the above code:
- The “df.groupby()” method is utilized to group the data according to the multiple columns and apply the “count” operation to the group using the “agg()” method.
- The “reset_index()” is used to reset the index of the Pandas DataFrame after determining the count for a specific group.
Output
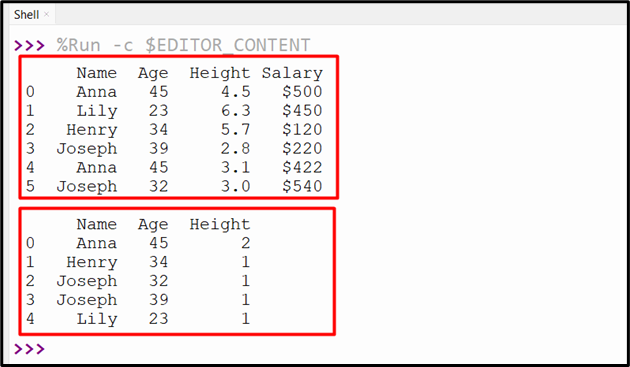
The count of the specified group has been determined successfully.
Getting Count for Each Group Using “DataFrame.transform()”
The “DataFrame.transform()” adds the new columns containing the count for the specified group of Pandas DataFrame. Let’s explore this via the following example:
data1 = ({'Name':["Anna", "Lily", "Henry", "Joseph", "Anna", "Joseph"],'Age' :[45, 23, 34, 32, 45, 32],'Height':[4.5, 6.3, 5.7, 2.8, 3.1, 3.0],'Salary':['$500', '$450', '$120', '$220', '$422', '$540']})
df = pandas.DataFrame(data1)
print(df,'\n')
df2 = df.groupby(['Name', 'Age']).Name.transform('count')
print(df2)
In this code:
- The “df.groupby()” method groups the DataFrame data based on the specified column’s value.
- After grouping the data, the “transform()” method determines the count for each group of the Pandas DataFrame.
Output
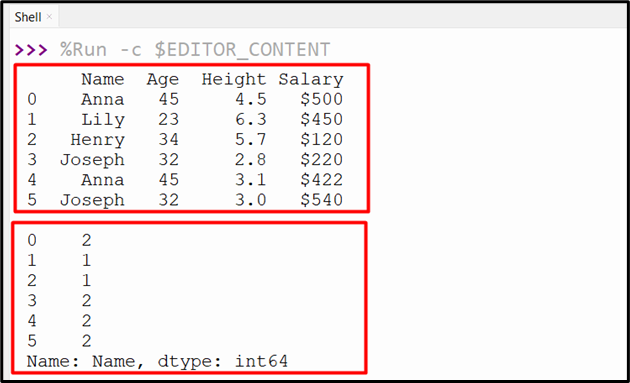
The count for rows of the specified group has been determined.
Conclusion
The “groupby()” method of the “pandas” module is used to split data into groups based on one or more columns and find out how many values are in a column for each group using the agg method, such as “count”. The other ways, such as “size()”, “agg()”, and “DataFrame.transform()”, can also be used to count the number of values in a column for each grouped data. This tutorial delivered a detailed guide on Pandas’ agg count using numerous examples.
Source: linuxhint.com