Matplotlib violin plot
Python’s “Matplotlib” plotting library offers a variety of visualizations that can be utilized to analyze data and interpret it. Matplotlib’s violin plot is one of the most useful and appealing plot types. Violin plots offer a unique way to understand data distributions in Python. This Python guide explores the approaches to creating violin plots for data analysis.
What is “Matplotlib Violin Plot” in Python?
The “matplotlib.pyplot.violinplot()” function is used for visualizing the distribution and density of data. This function combines the characteristics of a box plot and a kernel density plot to provide a comprehensive representation of the underlying data distribution. A violin plot is particularly useful when comparing distributions across multiple datasets.
Syntax
Parameters Value
According to the above syntax:
- The “dataset” parameter indicates the input data for which the violin plot needs to be created. It can be a single array or an array sequence.
- The “positions” parameter specifies the position along the “x-axis” where the violin plots will be placed. If not provided, the violins will be evenly spaced.
- The “vert” parameter contains the boolean value which indicates whether the violin should be vertical “True” or horizontal “False”.
- The “widths” parameter specifies the width of the violin plots.
- The “showmeans”, “showmedians” and “showextrema” are boolean values specifying whether to show the mean, median, minimum, and maximum values as markers in the plot.
- The “points” parameter specifies the number of points used to represent the KDE of the underlying distribution.
- The “bw_method” parameter indicates the bandwidth estimation method used for kernel density estimation. It can be a scalar or a callable function.
- The “quantiles” and “data” parameters are optional and can also be utilized in the matplotlib violin plot.
Return Value
The “matplotlib.pyplot.violinplot()” function returns a dictionary containing several elements, including “bodies”, “cmeans”, “cmedians”, “cmins and cmaxes”, and “cbars”. These return values can be used to further customize and annotate the violin plot as per specific requirements.
Example 1: Creating a Violin Plot
The below example code is utilized to create a basic violin plot in Python:
import matplotlib.pyplot as plt
data = [numpy.random.normal(0, std, 100) for std in range(1, 4)]
plt.violinplot(data)
plt.xlabel('Dataset')
plt.ylabel('Value')
plt.title('Basic Violin Plot')
plt.show()
According to the above code:
- The “matplotlib.pyplot” and “numpy” modules are imported.
- The “numpy.random.normal()” function is used to create a list of “3” arrays of “100” random numbers each with mean “0” and standard deviation “1”, “2” and “3”, respectively.
- The “plt.violinplot()” function is utilized to construct/create a violin plot of the provided data.
Output
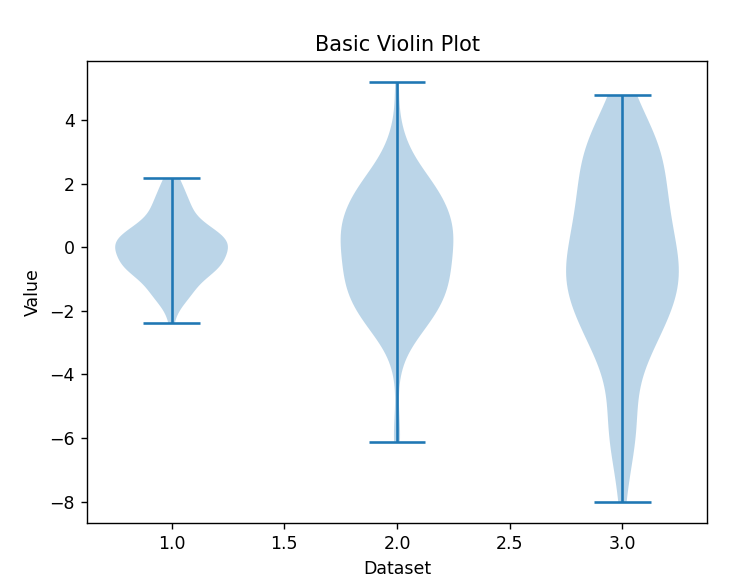
The basic violin plot has been created successfully.
Example 2: Customizing the Violin Plot
The “matplotlib.pyplot.violinplot()” function provides several parameters that allow customization of the violin plot, as follows:
import matplotlib.pyplot as plt
data = [numpy.random.normal(0, std, 100) for std in range(1, 4)]
plt.violinplot(data, positions=[1, 2, 3], widths=0.5, showmeans=True, showmedians=True,
showextrema=False, points=200, bw_method=0.5)
plt.xlabel('Dataset')
plt.ylabel('Value')
plt.title('Customized Violin Plot')
plt.show()
In this example:
- The “plt.violinplot()” function takes the “positions” parameter to set the positions of the violins on the x-axis and accepts the “widths” parameter to change the width of the violins.
- The “showmeans” and “showmedians” parameters are set to “True” to display markers for means and medians, respectively.
- Also, modify the number of points used for kernel density estimation and adjust the bandwidth estimation method using the “points” and “bw_method” parameters.
Output

The violin plot has been customized with various parameters accordingly.
Conclusion
The “matplotlib.pyplot.violinplot()” function in Python is a versatile tool for visualizing data distributions using violin plots. This function also provides various parameters that are used to create and customize violin plots. This blog presented a complete guide on the Python “violinplot()” function of the “matplotlib.pyplot” module using numerous examples.
Source: linuxhint.com