Matplotlib Vertical Line
“Matplotlib” is a powerful Python library for data visualization that offers many plotting functions to create high-quality graphs and charts. This Python guide will provide an in-depth overview of creating vertical lines via Matplotlib, which can help us highlight or represent specific data points or events on a plot as per the requirements.
How to Create Vertical Lines in Matplotlib?
To create vertical lines using Matplotlib, apply the following approaches:
Method 1: Create Vertical Lines Using the “axvline()” Function
The easiest way to create a vertical line in Matplotlib is via the “axvline()” function.
Example 1: Creating a Single Vertical Line
The below code is used to create a single vertical line in Python:
plt.figure(figsize = (10, 5))
plt.axvline(x=3, color='r')
plt.show()
In the above code, the red vertical line at “x=3” is created using the “axvline()” function. The color, line style, and thickness can be customized through the optional parameters of the “axvline()” function.
Output
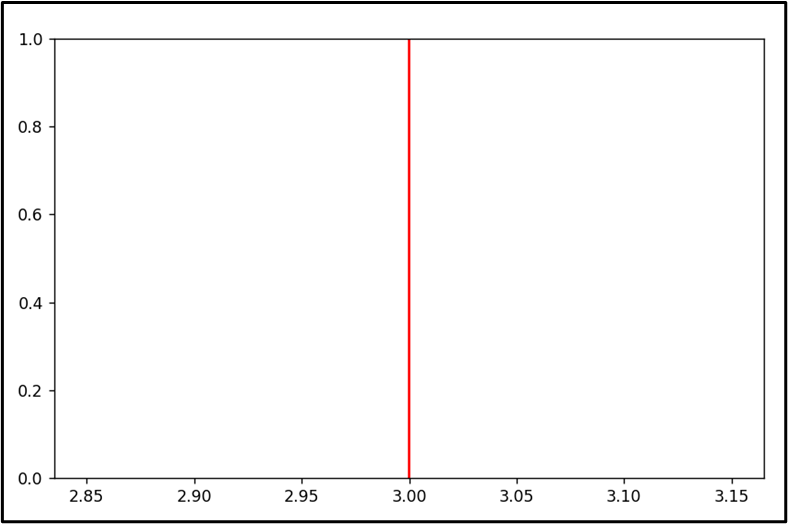
The single vertical line has been created in the above snippet accordingly.
Example 2: Creating Multiple Vertical Lines
The below-stated code is used to create multiple vertical lines to a plot:
plt.figure(figsize = (8, 5))
plt.axvline(x=2, color='r', linestyle='--')
plt.axvline(x=3, color='g', linestyle='--')
plt.axvline(x=4, color='b', linestyle='--')
plt.show()
In the above code snippet, add three vertical lines at “x=2”, “x=3”, and “x=4” with different “colors” and “linestyles”, respectively.
Output
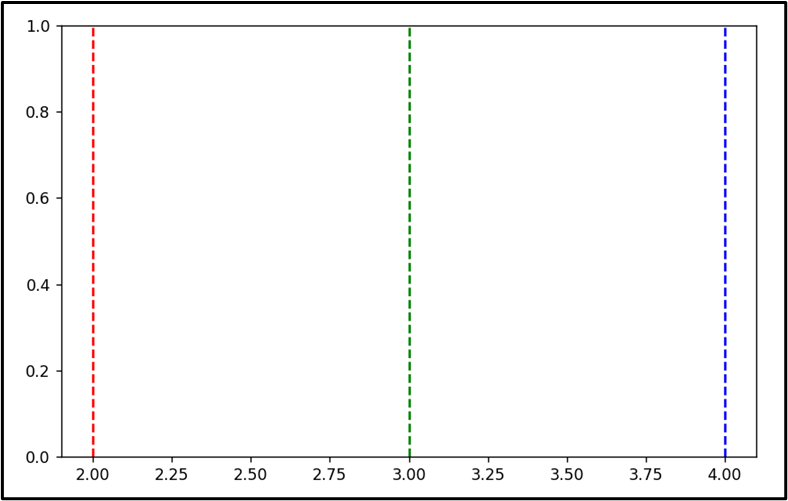
Based on the above output, it is verified that multiple vertical lines have been created successfully.
Method 2: Create Vertical Lines Utilizing the “vlines()” Function
Another way to create vertical lines in Matplotlib is by applying the “vlines()” function. This particular function is helpful when you want to add multiple vertical lines at once.
Example
Let’s overview the following code:
plt.figure(figsize = (8, 5))
plt.vlines(x=[2, 4], ymin=0, ymax=10, color='g')
plt.show()
According to the above code, the “plt.vlines()” function is used to create two green vertical lines at “x=2” and “x=4”. The line color, line style, and thickness can be customized via the “vlines()” function optional parameters.
Output

The above output implied that the vertical lines are created appropriately.
Note: If there is a need to highlight some information related to the created lines, apply the below-given approach.
Approach: Create Vertical Spans Using the “ax.axvspan()” Function
The “ax.axvspan()” function highlights a region between two vertical lines.
Example
The below code is used to create vertical spans:
plt.figure(figsize = (8, 5))
plt.axvspan(xmin=2, xmax=4, alpha=0.2, color='b')
plt.show()
In the above code lines, the “plt.axvspan()” function highlights the region between “x=2” and “x=4” with a blue color and with a transparency of “0.2”.
Output

The above output verified that the specific region has been highlighted between the specific vertical lines.
Conclusion
To create single or multiple vertical lines on your plots, various methods such as “axvline()”, “vlines()” are used in Python. The “ax.axvspan()” method however highlights a region between the created vertical lines. This blog demonstrated the approaches to creating a vertical line in Python.
Source: linuxhint.com