Matplotlib Log Scale
This Python guide provides a complete guide on the “Matplotlib” log scale using numerous examples.
“Logarithmic Scaling” in Matplotlib
“Matplotlib” a data visualization library supports logarithmic scaling for both axes in a plot. We can use the “plt.xscale()” and “plt.yscale()” functions to set the scaling for the “x-axis” and “y-axis”, respectively.
Example 1: Logarithmic Scaling For the “x-Axis”
To set a logarithmic scale for the “x-axis”, use the “plt.xscale()” function with the parameter “log”. Following is an example code:
import numpy
x = numpy.linspace(0, 10, 100)
y = numpy.exp(x)
plt.plot(x, y)
plt.xscale('log')
plt.show()
In this example, create a simple plot of the exponential function “exp(x)” for “x” in the range of “0” to “10”. After that, set the “x-axis” scale to logarithmic via the “plt.xscale()” function.
Output
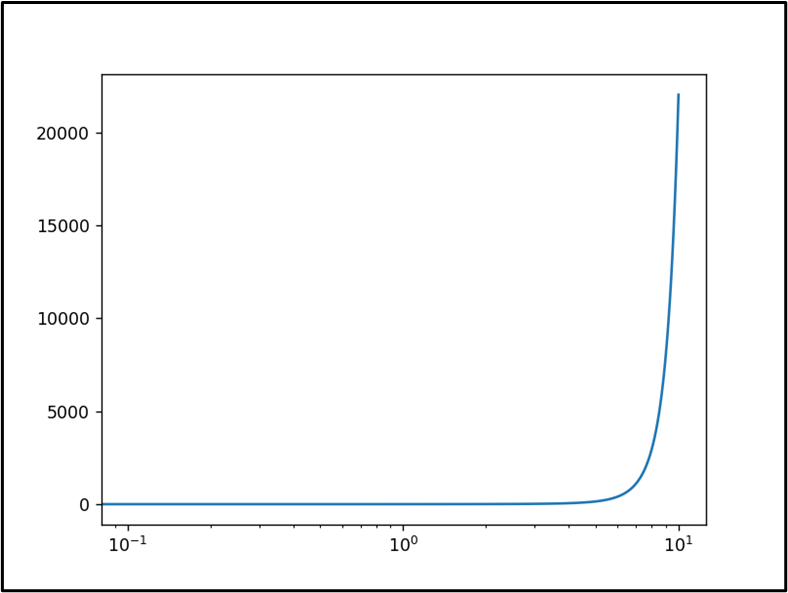
The above output shows that the logarithmic scale of the “x-axis” has been created.
Example 2: Logarithmic Scaling For the “y-Axis”
To set a logarithmic scale for the “y-axis”, use the “plt.yscale()” function with the parameter “log”, as follows:
import numpy
x = numpy.linspace(0, 10, 100)
y = numpy.exp(x)
plt.plot(x, y)
plt.yscale('log')
plt.show()
In the above code block, likewise, create a simple plot of the exponential function “exp(x)” for “x” in the range of “0” to “10”. Now, set the “y-axis” scale to logarithmic using the “plt.yscale()” function.
Output
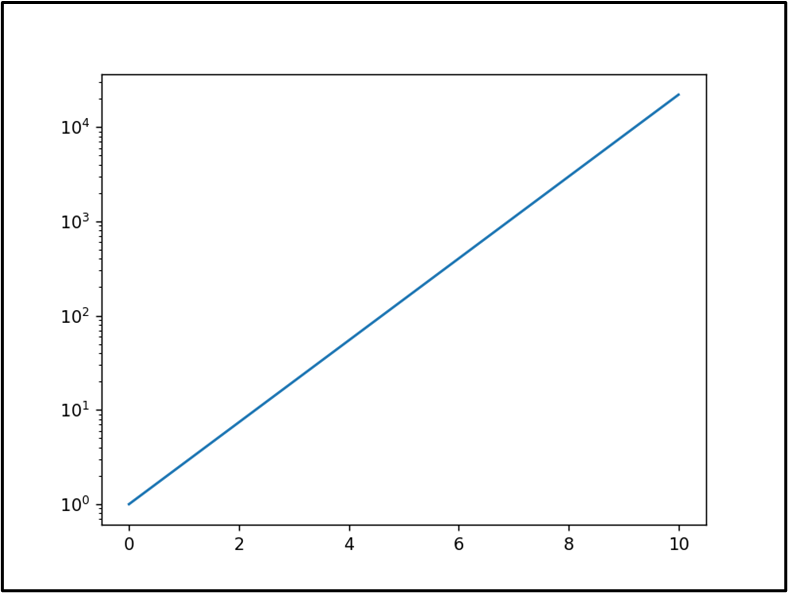
The above snippet shows that the logarithmic scale of the “y-axis” has been created accordingly.
Conclusion
“Logarithmic scaling” is a useful tool for visualizing data that covers a wide range of magnitudes. “Matplotlib” provides built-in functions “plt.xscale()” and “plt.yscale()” for logarithmic scaling of both the “x” and “y” axis, respectively. This allows the users to create effective visualizations of large and small data values. This Python post presented a complete guide on the Matplotlib log scale using numerous examples.
Source: linuxhint.com