Matplotlib Line Thickness
To truncate or expand the boundaries of a plot is a necessary feature in Python’s “matplotlib” library. By using this library, developers can create multiple inferences and make their work more creative. When the plot line is contracted by using this particular library, the default line width value will be “1”. However, this value can be changeable by using the “linewidth” parameter.
The outcomes from this guide are:
- What is Matplotlib in Python?
- How to Change the Thickness of Single Lines in Python?
- How to Change the Thickness of Two Lines in Python?
- How to Change the Thickness of Multiple Lines in Python?
What is Matplotlib in Python?
To create interactive visualization, animation, and static, the “matplotlib” library can be used. It makes things easier. It includes different functions for multiple purposes, such as changing the width of the plot line and many more.
How to Change the Thickness of Single Lines in Python?
To change the single line width/thickness in Python, the “matplotlib” can be used. To do so, first, import the modules of the “matplotlib.pyplot” and “numpy” libraries:
import numpy as np
Use the “np.array()” function to define the dataset for normal line and modified line. Then, store these arrays in the “normalLine”, and “thickLine” variables:
thickLine = np.array([5, 4, 6, 8, 9, 11])
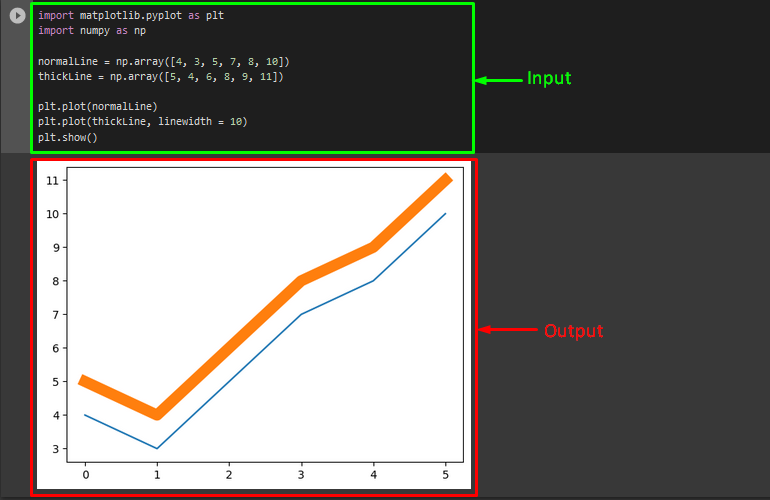
Now, display the normal line plot by calling the “plt.plot()” method. Then, to get the line with changed width, declare the “linewidth” parameter and assign it any particular value that needs to represent the desired width of the plot. In our case, we have used the width size of “10”. Lastly, apply the “show()” method to display the plot:
plt.plot(thickLine, linewidth = 10)
plt.show()
The difference between normal and thick lines has been shown in the below-given output:

How to Change the Thickness of Multiple Lines in Python?
If users want to change the thickness of multiple lines simultaneously in Python, the “for” loop can be used.
For this purpose, first, declared variables for storing data sets of the x-axis and y-axis. Then, to define the x-axis data points, invoke the “np.linspace()” method along with the required parameters. After that, use the “np.sin()” function for defining the y-axis:
h = np.sin(v)
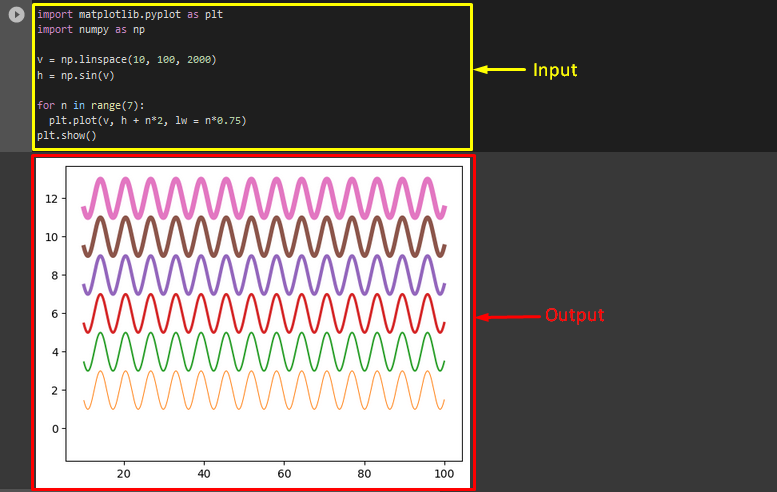
Now, declare the “for” loop with the desired number of the line as ranges and used the “lw” as the short form of the line width. Lastly, apply the “plot.show()” method to show the resultant plot:
plt.plot(v, h + n*2, lw = n*0.75)
plt.show()
Output

We have compiled the method for changing the thickness of a line in Python.
Conclusion
To change the line width/thickness in Python, the “matplotlib” library can be used. This library creates interactive visualization, animation, and static to make things easier. This guide demonstrated the easiest ways for changing the thickness of a line in Python.
Source: linuxhint.com
