Matplotlib Legend Location
A popular Python library named “Matplotlib” allows you to create/make different types of plots, such as line charts, bar charts, scatter plots, etc. “Matplotlib” also provides many features to customize your plots, such as colors, labels, titles, axes, grids, and legends. A “legend” is a box that explains the meaning of the symbols or colors used in a plot. It can help you make your plots more informative and understandable for your audience.
This blog provides/presents a detailed guide on how to create a basic legend with Matplotlib, and how to change its location using appropriate examples.
How to Change/Modify the Location of a Legend in Matplotlib?
By default, “Matplotlib” places the legend at the best location that does not overlap with the plot. However, to change the location of a legend in Matplotlib the “loc” parameter is used in the “legend()” function. The “loc” parameter accepts either a numeric code or a string that specifies one of the predefined locations. Here are the available options:
- “0” or “best”: The best location that does not overlap with the plot (default).
- “1” or “upper right”: The upper right corner of the plot.
- “2” or “upper left”: The upper left corner of the plot.
- “3” or “lower left”: The lower left corner of the plot.
- “4” or “lower right”: The lower right corner of the plot.
- “5” or “right”: The right center of the plot.
- “6” or “center-left”: The center left of the plot.
- “7” or “center-right”: The center right of the plot.
- “8” or “lower center‘`: The lower center of the plot.
- “9” or “upper center”: The upper center of the plot.
- “10” or “center”: The center of the plot.
Example 1: Using the “loc” Parameter
To place the legend at the “upper left corner” of the plot, the “loc” parameter is allocated as follows:
x_axes = [2.5, 3.5, 4.5, 5, 5.5]
y1 = [10, 20, 30, 40, 50] #line 1
y2 = [15, 25, 35, 45, 55] #line 2
plt.plot(x_axes, y1, label='Line 1')
plt.plot(x_axes, y2, label='Line 2')
plt.legend(loc=2)
plt.show()
In the above code, the “plt.legend()” function takes the “loc=2” (which means “upper left”) as an argument to add a legend at the specific location of the plot.
Output
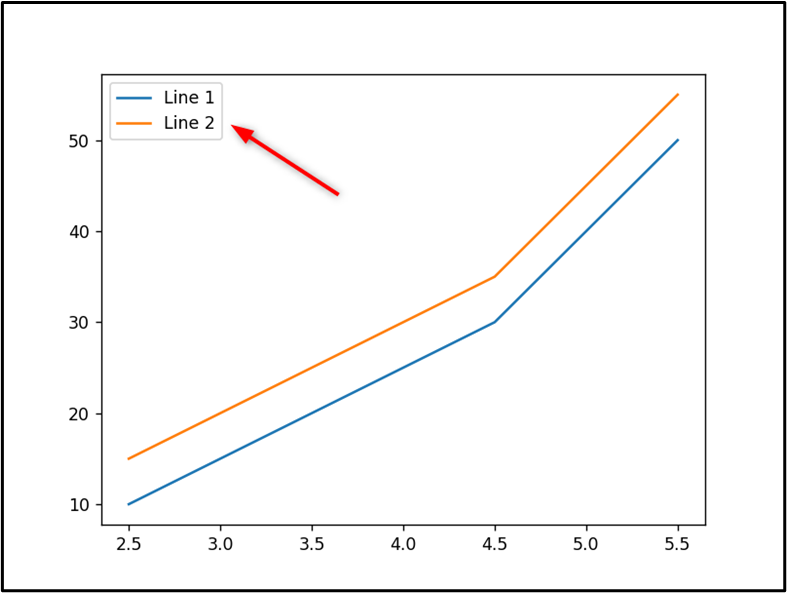
In the above output, the “Legend” is added at the upper left corner of the plot appropriately.
Example 2: Using the “loc” Parameter With Tuple
The “loc” parameter can also be used with a tuple of coordinates that specify the exact position of the legend in the plot. The coordinates are relative to the axes, where “(0,0)” is the lower/bottom left corner and “(1,1)” is the upper/top right corner.
For instance, if you want to place the legend at the middle right of the plot, you can allocate the parameter as “loc= (0.5, 0.5)”, indicated below:
x_axes = [2.5, 3.5, 4.5, 5, 5.5]
y1 = [10, 20, 30, 40, 50]
y2 = [15, 25, 35, 45, 55]
plt.plot(x_axes, y1, label='Line 1')
plt.plot(x_axes, y2, label='Line 2')
plt.legend(loc= (0.5, 0.5))
plt.show()
In the above code block, the “plt.legend()” function takes a tuple of coordinates and adds the legend at the specific position of the plot.
Output
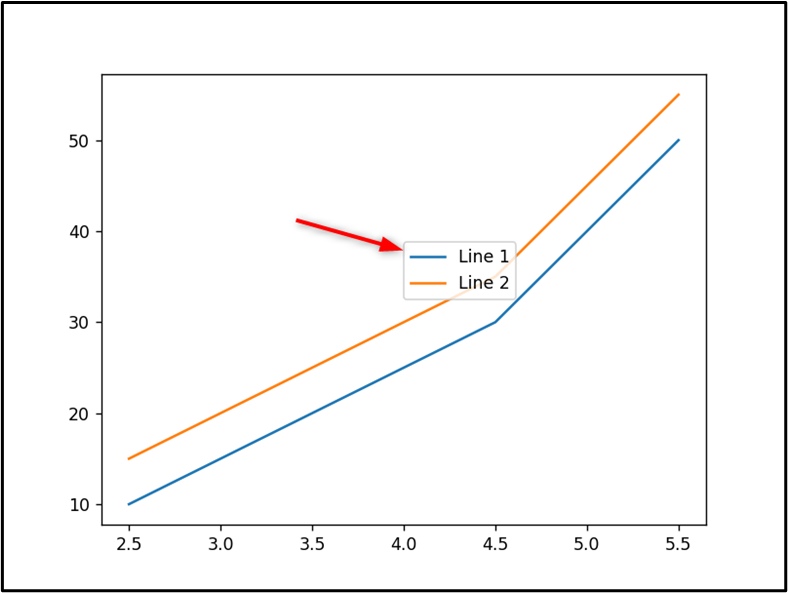
The legend has been added at the middle right of the plot in the above output snippet.
Add a Legend Outside the Plot Area
Sometimes you may want to adjust the size, and shape of a legend to fit better with your plot or design.
To adjust the size and shape of a legend in Matplotlib, the “bbox_to_anchor” parameter is used in the “legend()” function. The “bbox_to_anchor” parameter accepts a tuple of four values that specify the bounding box of the legend in the figure coordinates, where “(0,0)” is the lower left corner and “(1,1)” is the upper right corner. The four values are:
- “x”: The horizontal position of the lower/bottom left legend corner.
- “y”: The vertical position of the lower left corner of the legend.
- “width”: The width of the legend.
- “height”: The legend height.
Example
To place the legend outside the plot area on the right side, the allocated parameters “bbox_to_anchor=(1.05, 0.5)” and “loc=’center left’” are used in Python:
x_axes = [1.5, 2.5, 3.5, 4.5]
y1 = [10, 20, 30, 40]
y2 = [15, 25, 35, 45]
plt.plot(x_axes, y1, label='Line 1')
plt.plot(x_axes, y2, label='Line 2')
plt.legend(bbox_to_anchor=(1.05, 0.5), loc='center left')
plt.show()
Here, the “bbox_to_anchor=(1.05, 0.5)” parameter is used along with the “loc= ‘center left’” parameter to plot the legend outside the plot at the right side of the box.
Output
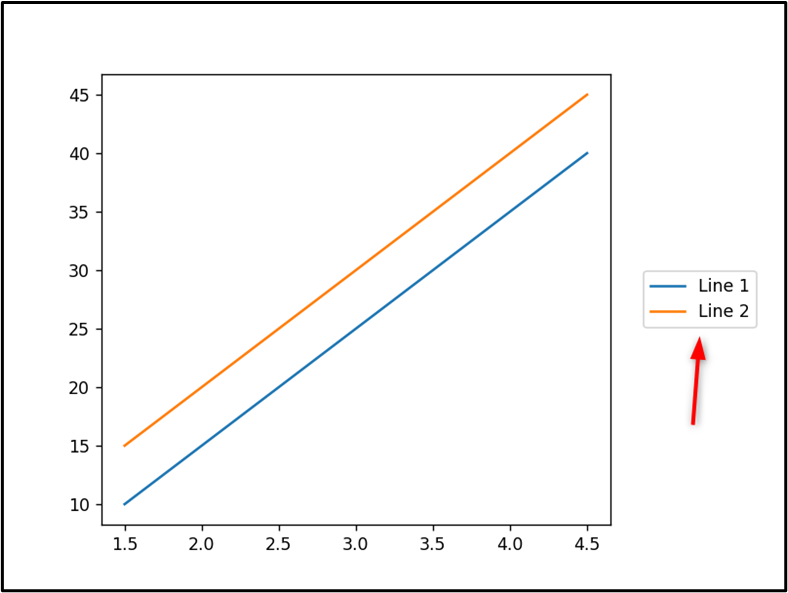
The legend has been added outside the plot at the center-left position of the plot in the above snippet.
Conclusion
To change the legend location with Matplotlib, utilize the “loc” parameter, or the “bbox_to_anchor()” parameter. This Python article presented various ways to plot and change the Matplotlib “Legend” location using appropriate examples.
Source: linuxhint.com