Matplotlib Invert Y-Axis
The outcomes of this blog are:
- How to Use Matplotlib “invert_yaxis()” Function to Invert Y-Axis in Python?
- How to Use Matplotlib “plt.ylim()” Method to Invert Y-Axis in Python?
- How to Use Matplotlib “plt.axis()” Method to Invert Y-Axis in Python?
How to Use Matplotlib “invert_yaxis()” Function to Invert Y-Axis in Python?
The matplotlib library’s “invert_yaxis()” function can be used to invert or reverse the y-axis position in Python. For this purpose, first, import the required libraries, such as “matplotlib.pyplot” and “numpy”:
import numpy as np
Next, apply the numpy library’s “linspace()” function to generate the x-series data points. Then, use the “sin()” function and pass it to the “x” variable that contains the generated x series data points. That will retrieve the value of the angle in degrees and radians. After that, store into the “y” variable:
y = np.sin(x)
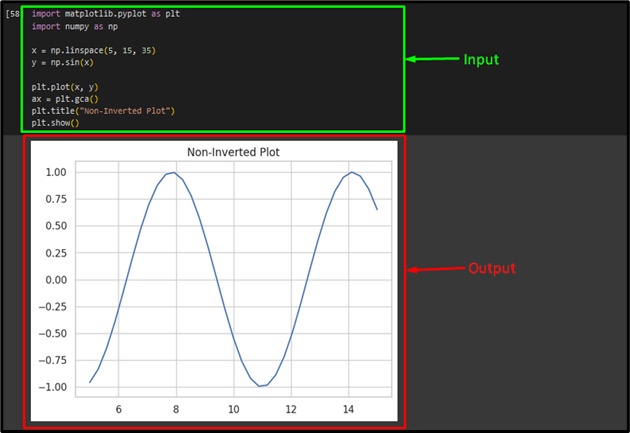
Now, use the “plt.plot()” method that contains the “x” and “y” as an argument. Then, apply the “plt.gca()” function which is a module of the “matplotlib” library to retrieve the axes instances on the current graph matching the provided keywords “arg”, or create one. In the next line, we have invoked the “plt.title()” method and specified the plot title. Lastly, call the “plt.show()” method to display the resultant figure:
ax = plt.gca()
plt.title("Non-Inverted Plot")
plt.show()
As a result, the graph has been displayed without an inverted y-axis:
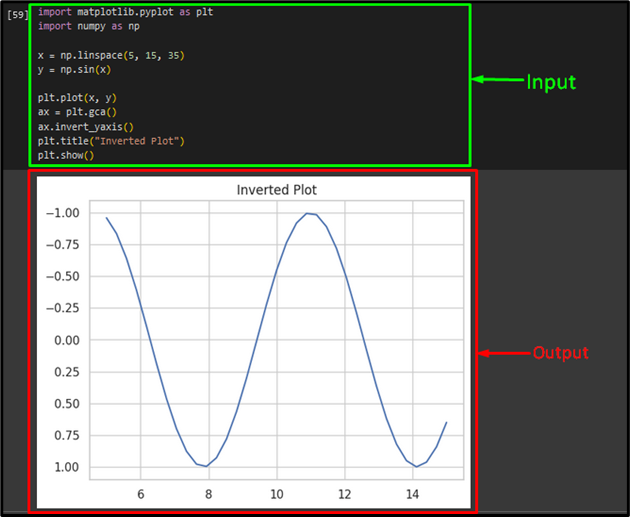
Now, to revert the y-axis, apply the “invert_yaxis()”. Then, specify the graph title by using the “plt.title()” method and call the “plt.show()” method to show the figure:
plt.title("Inverted Plot")
plt.show()
According to the following output, the y-axis of the graph has been reverted successfully:
How to Use Matplotlib “plt.ylim()” Method to Invert Y-Axis in Python?
The matplotlib library’s “plt.ylim()” method is also used for inverting the y-axis of the graph in Python. To do so, import the below given Python libraries:
import numpy as np
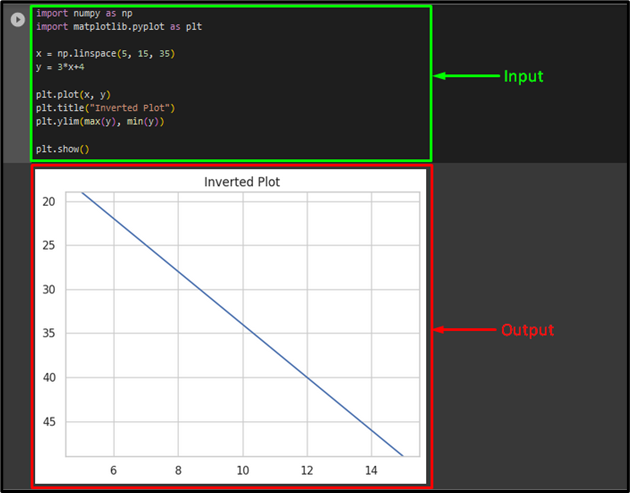
Then, specify the “linspace()” function to create the x-series data points. Next, use the equation for a straight line as we need to plot a straight line in the graph that has its origin at the y-axis and save it into the “y” variable:
y = 3*x+4
Now, apply the “plt.plot()” method that is used to draw the points in a graph:
After that, specify the plot title with the help of the “plt.title()” method. Now, call the “plt.ylim()” method to flip the desired axis of the graph. Here, we have passed the “max” and “min” parameters to this function. Then, invoke the “plt.show()” method to get the resultant plot figure:
plt.ylim(max(y), min(y))
plt.show()
Output
How to Use Matplotlib “plt.axis()” Method to Invert Y-Axis in Python?
By using the “plt.axis()” method, users can revert the axis of the graph. For this corresponding purpose, use the previously described code and then, apply the “plt.axis()” method having both axes “max” and “min” values:
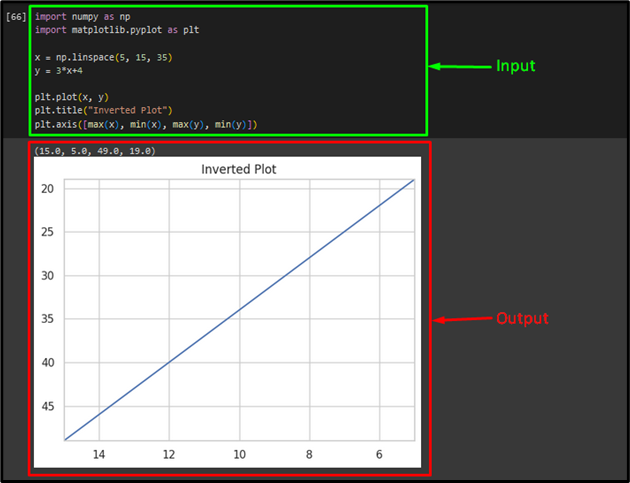
You have learned about the different methods for inverting the matplotlib y-axis in Python.
Conclusion
To revert the graph’s y-axis in Python, the “matplotlib” library provided multiple methods, such as the “invert_yaxis()” method, “plt.ylim()” method, and the “plt.axis()” method. This guide illustrated the “matplotlib” library methods for inverting the y-axis in Python.
Source: linuxhint.com