Matplotlib Grid
This post contains the following content:
How to Create a Basic Plot With Matplotlib Grid?
To create a basic plot with a “Matplotlib Grid”, import the “matplotlib” library and create some sample data.
Example: Creating a Scatter Plot With Matplotlib Grid
Let’s create a scatter plot via the following example code:
import numpy as np
value_1 = np.random.normal(size=500)
value_2 = np.random.normal(size=500)
plt.scatter(value_1, value_2)
plt.grid()
plt.show()
In the above code, firstly create a scatter plot with “500” random data points. After that, the “plt.grid()” function is used to enable the grid lines in the plot. Note that by default, the grid lines are displayed with a solid, gray color.
Output
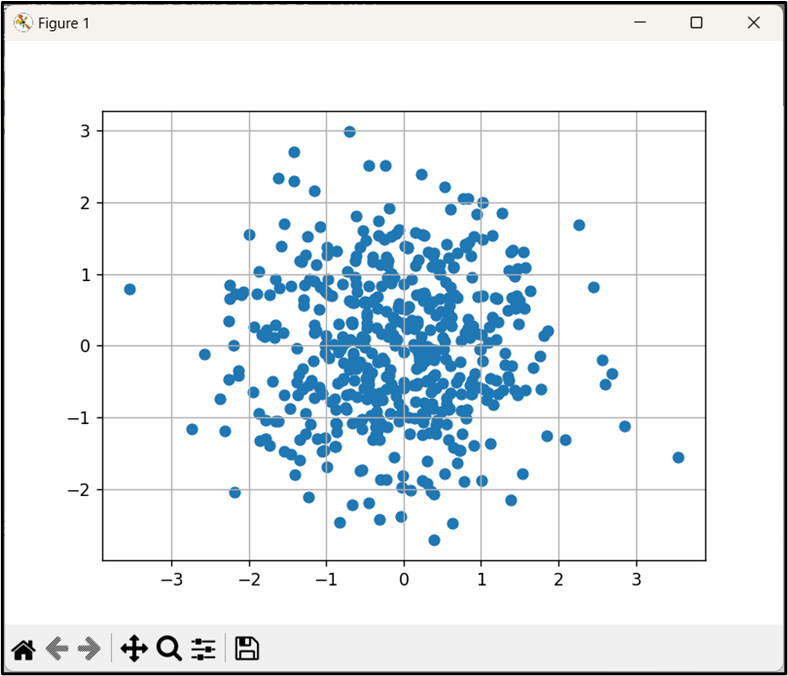
In the above output, the grid line has been enabled in the scatter plot via the “plt.grid()” function.
How to Customize the Grid Lines in Python?
“Matplotlib Grid” allows us to customize the grid lines in a plot as well. We can change the “color”, “style”, and “width” of the grid lines. Let’s perform this customization using the below examples:
Example 1: Changing the “Color” of the Matplotlib Grid Lines
The “color” attribute can be applied to change the color of matplotlib grid lines:
import numpy as np
value_1 = np.random.normal(size=500)
value_2 = np.random.normal(size=500)
plt.scatter(value_1, value_2)
plt.grid(True, color='r')
plt.show()
In the above code, the “plt.grid()” function assigns the “color” attribute value as “r” which enables the grid line in “red” color to the specified scatter plot.
Output
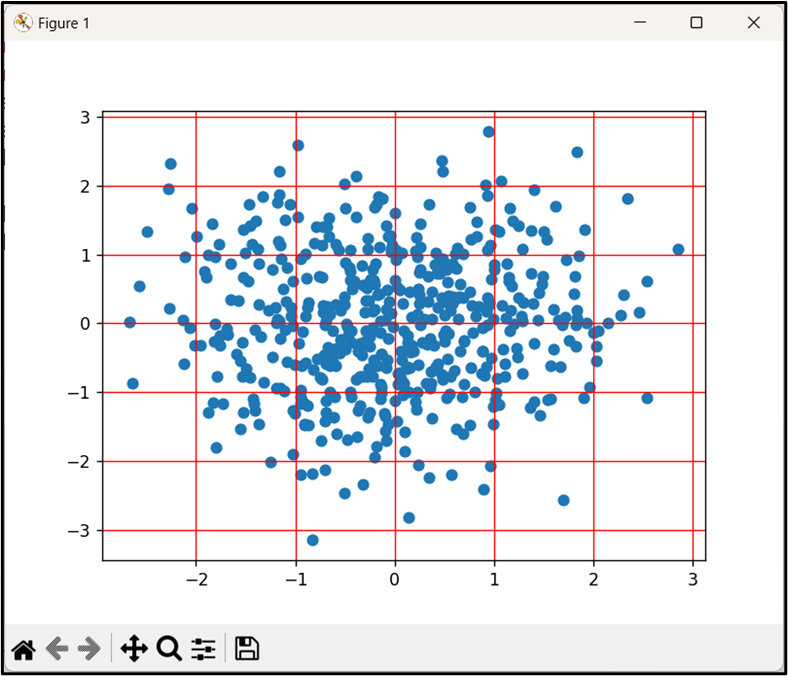
In the above output snippet, the color of the grid lines has been changed accordingly.
Example 2: Changing the “Style” of the Matplotlib Grid Lines
“Matplotlib Grid” supports various line styles for the grid lines. In order to modify the linestyle of the grid lines, use the “linestyle” argument/attribute. Let’s change the style of the grid lines to “dashed” via the below-stated code:
import numpy as np
value_1 = np.random.normal(size=500)
value_2 = np.random.normal(size=500)
plt.scatter(value_1, value_2)
plt.grid(True, linestyle='--')
plt.show()
According to the above code snippet, the “plt.grid()” function assigns the “linestyle” argument as =‘–’ which changes the style of the grid lines in a corresponding manner.
Output
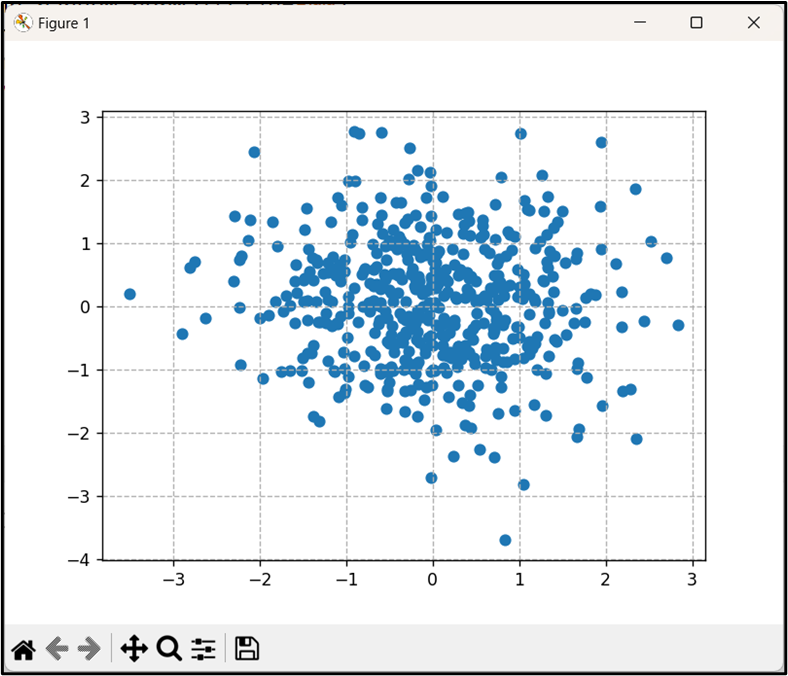
As seen, the style of the grid lines has been changed.
Example 3: Changing the “Width” of the Matplotlib Grid Lines
The width of the grid lines can also be changed using the “linewidth” attribute, as follows:
import numpy as np
value_1 = np.random.normal(size=500)
value_2 = np.random.normal(size=500)
plt.scatter(value_1, value_2)
# Change the width of the grid lines to 2
plt.grid(True, linewidth=2, color='r')
plt.show()
In the above output, the “plt.grid()” function assigns the “linewidth” attribute as “2”, and the color attribute as “r” to change the line width and color of the grid lines, respectively.
Output
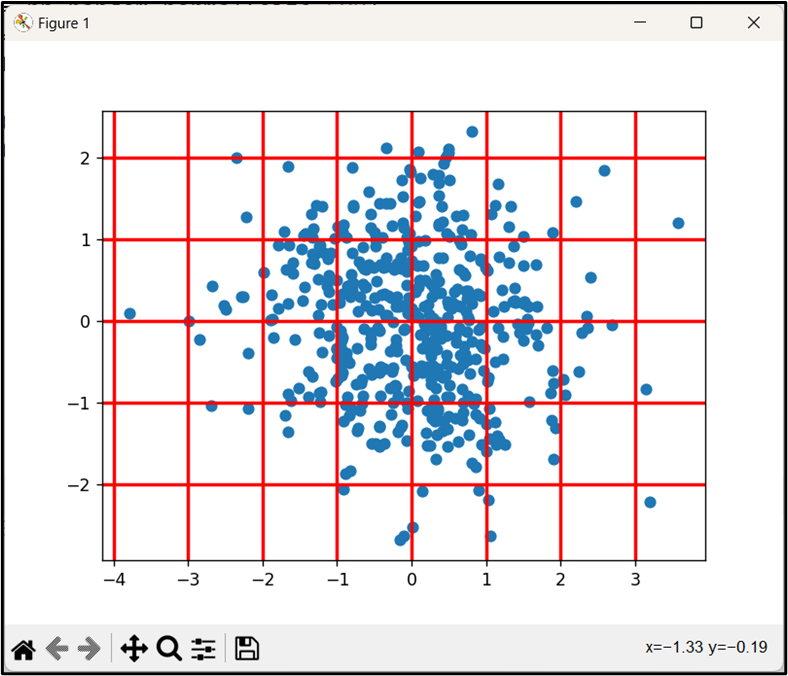
The above snippet shows that the grid line width and color have been changed.
Conclusion
To create and customize grid lines in Python, the “plt.grid()” function of the “Matplotlib” library is used along with various attributes. Also, the grid lines can be customized such as changing the color, style, width, etc. by applying various attributes of the “plt.grid()” function. This Python blog presented an in-depth guide on how to enable the gridlines in any matplotlib plot and customize them using various attributes.
Source: linuxhint.com