Matplotlib Font Size
Through this guide, you will understand how to manage and tweak the default font size in your matplotlib plots.
Let us start by creating a simple plot using sample data.
plt.plot([2,4,6,8,10], label="Orange", color='orange')
plt.suptitle('Sample Plots')
plt.xlabel('x-axis')
plt.ylabel('y-axis')
plt.legend()
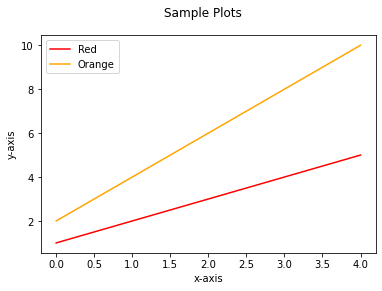
The code above should generate a simple line plot with a title, labels on the x and y-axis, and a legend for reference.
The resulting diagram is shown:
Once we have the sample plot working for us, let us customize the font size of various elements of the plots
Matplotlib Customize Size for All Elements
To update the font size for all the plots and their corresponding elements, you need to use the rcParams parameter.
The rcParams parameter is a dictionary with various components to adjust various properties of matplotlib plots.
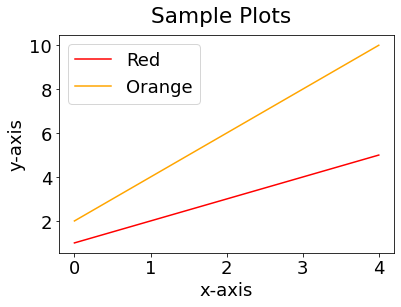
To change the font size of all the plots and elements to 20, we can run the code:
plt.rcParams.update({'font.size': 20})
In the code above, we use the rcParames.update() method to update the ‘font.size’ key. We then pass the value to the target font size.
You can then re-run your plots and the changes will be reflected as:

To view all the keys of the rcParams parameter:
'agg.path.chunksize': 0,
'animation.bitrate': -1,
'animation.codec': 'h264',
'animation.convert_args': [],
'animation.convert_path': 'convert',
'animation.embed_limit': 20.0,
'animation.ffmpeg_args': [],
'animation.ffmpeg_path': 'ffmpeg',
'animation.frame_format': 'png',
'animation.html': 'none',
'animation.writer': 'ffmpeg',
'axes.autolimit_mode': 'data',
'axes.axisbelow': 'line',
'axes.edgecolor': 'black',
'axes.facecolor': 'white',
'axes.formatter.limits': [-5, 6],
… output truncated….
It is good to keep in mind that updating the font.size key will affect all the plots and elements in matplotlib.
Although the above method is very effective for quick font size adjustments, it might be what you are looking for.
Matplotlib Change Font Size of Individual Components
If you want to adjust the font size of individual components within a specific plot, you need to use the rc parameter.
This parameter allows you to specify which component you target to adjust the font size.
Let us start by setting the default font size using the rc parameter. For that, we can do:
The code above allows you to reset the default value to the specified value.
To change the font size of the axes title:
You will notice that the font size of the axes of the plot is updated as:
To change the font-size for the labels:
The resulting figure is as shown:
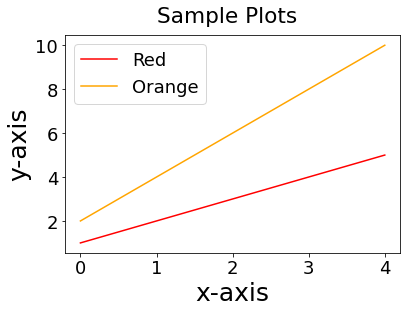
Notice how the font of the labels is larger than the default value.
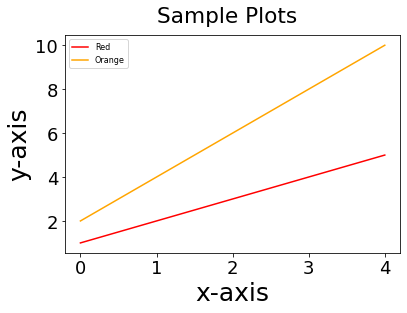
To update the font size of the legend, use the legend as the component name as:
The code above should set the legend font size to a small value as shown in the resulting diagram.
To change the font size of the x tick and y tick labels, respectively, run:
plt.rc('ytick', labelsize=16)
The code above should update the x and y tick labels to the specified font size.
Matplotlib Restore Default Font Size
If you have modified the default plot font size, you can restore to the default value as:
The code above should return all the font sizes to default.
Conclusion
This guide explored various methods of changing the font size in Matplotlib plots. We also discussed how to modify the font size of individual components within a specific plot.
The ability to modify the font size for various parts of a plot allows you to increase the readability of your plots.
Source: linuxhint.com