Matplotlib Figure Title
In Python, the “matlibplot” is a data visualization library for 2D plots of arrays. It is a multi-forum library that is built on the Numpy arrays having multiple functions/methods, such as the “plt.title()” function that is used for adding titles in the graph.
In this article, we will discuss the process for adding titles in the graph by using the “matplotlib.pyplot” library.
How to Add the Title of Plot Using “matlibplot.pyplot.title()” Method in Python?
To add titles in the 2D graphs, the “matplotlib.pyplot” library can be utilized. The title can be added to the graph for identification and explanation. By utilizing the “title()” method, users can change/add font, size, alignment, color, location, and many more.
Let’s take an example of adding the tile, location, and text color to the graph!
Example 1
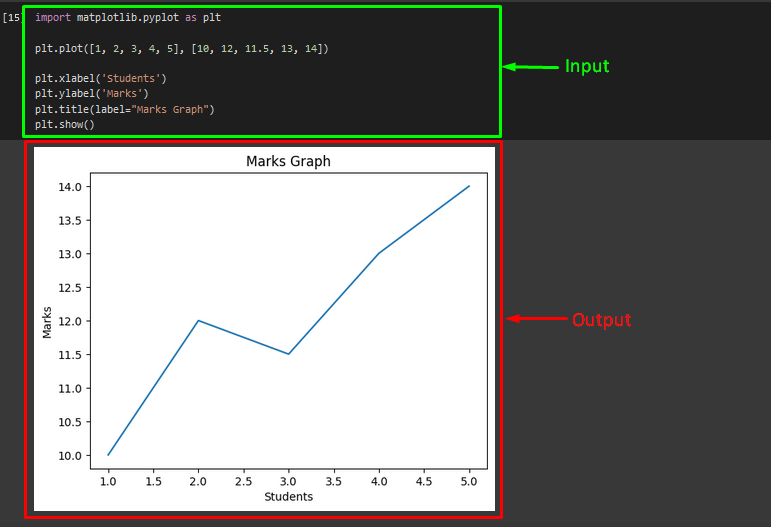
First, import the “matplotlib.pyplot” library. Then, assign data points for the both “x-axis” and “y-axis” by using the “plt.plot” method:
plt.plot([1, 2, 3, 4, 5], [10, 12, 11.5, 13, 14])
Now, for depicting the visualization, use the “plt.xlabel()” and “plt.ylabel()” methods and pass the axis labels. After that, we invoke the “title()” method for displaying the title and pass the “label” parameter along with the desired plot title. Then, use the “plt.show()” method to display the figure:
plt.ylabel(‘Marks’)
plt.title(label="Marks Graph")
plt.show()
It can be seen that the below-given plot has the title “Marks Graph” at default position:
Example 2
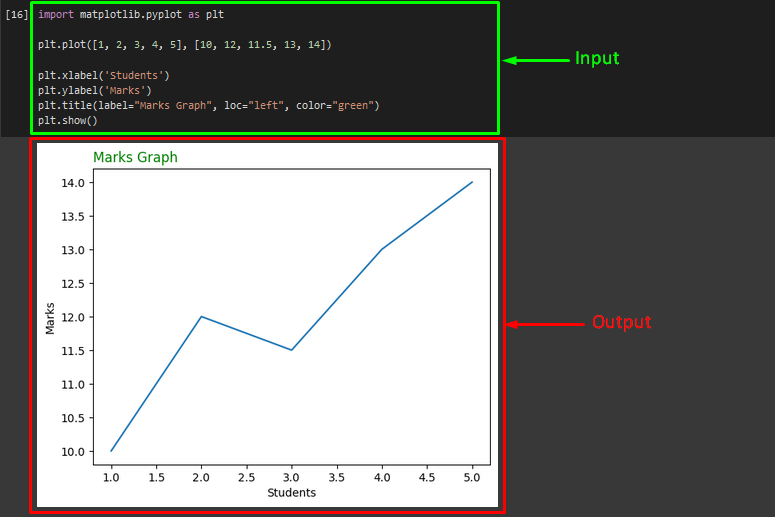
If you want to adjust the position of the plot graph and add the color, call the “plt.title()” method that takes the “loc” (location), and “color” parameters along with the values to it. Then, apply the “plt.show()” method for displaying the resultant figure:
plt.show()
According to the provided output, the position of the title has been changed to the “left” side of the graph and its text color also changed to green:
That’s all! We have explained the process to add the figure title by using the “matplotlib.pyplot” library.
Conclusion
The “matplotlib.pyplot” library can be used for adding titles in the graph for identification and explanation. It can also be used to change/add font, size, alignment, color, location, and many more. In this article, we have provided the procedure for adding titles in the graph by using the “matplotlib.pyplot” library.
Source: linuxhint.com