Matplotlib Bold Text
Bold text is a powerful tool in data visualization that can help emphasize important information and make it stand out in a plot. “Matplotlib” provides several parameters that can be used to modify the style of text, such as fontfamily, fontsize, fontstyle, fontweight, color, etc.
This post provides various ways to bold a text in Matplotlib using numerous examples.
How to Create Bold Text in Matplotlib?
The “Matplotlib” module provides several ways to create bold text in the plots, depending on the preference and specific use case. The following are the common methods:
Method 1: Bold Text in Matplotlib Using the “fontweight” Parameter
The “fontweight” parameter is used to set the weight of the particular font. Some of the font-weight values are normal, bold, light, heavy, ultrabold, etc. This parameter is used in the below code to the bold text of the matplotlib graph:
Name = [‘Joseph’, ‘ALex’, ‘Henry’, ‘Anna’, ‘John’]
Age = [25, 42, 52, 29, 27]
plt.bar(Name, Age)
plt.title(‘Example Title’, fontweight=‘bold’)
plt.xlabel(‘X Label’, fontweight=700)
plt.ylabel(‘Y Label’, fontweight=‘bold’)
plt.show()
In the above code:
- Firstly, the “pyplot” module is imported as plt at the start of the program.
- The “bar()” function is used to create the bar chart of the given specified data.
- The “fontweight” parameter is used with the “plt.title()”, “plt.xlabel()” and “plt.ylabel()” functions, respectively to bold the title and labeling of the bar graph.
Output
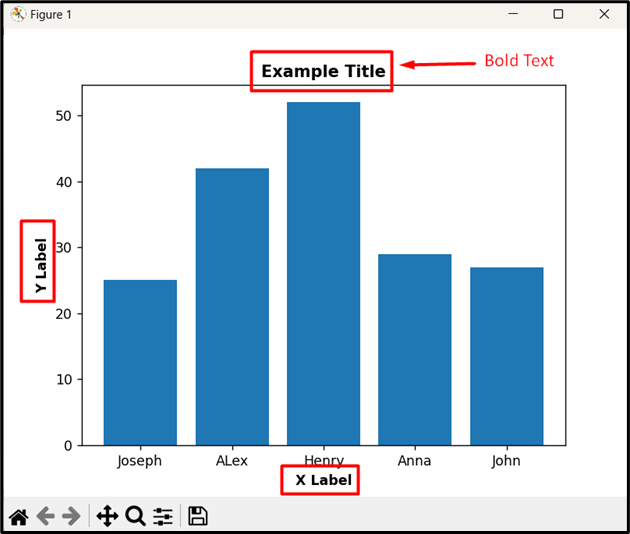
In this outcome, the title text, xlabel, and ylabel text have become bold via the discussed parameter.
Method 2: Bold Text in Matplotlib Using the “weight” Parameter
The “weight” parameter in Matplotlib is an alternative to the fontweight parameter, and it can also be used to bold the text. Here is an example:
Name = [‘Joseph’, ‘ALex’, ‘Henry’, ‘Anna’, ‘John’]
Age = [25, 42, 52, 29, 27]
plt.bar(Name, Age)
plt.title(‘Example Title’, weight=‘bold’)
plt.xlabel(‘X Label’, weight=700)
plt.ylabel(‘Y Label’, weight=‘bold’)
plt.text(‘Joseph’, 45, ‘Bold Font’, fontsize=16, weight=‘bold’, color= ‘red’)
plt.show()
In the above code, recall the discussed approaches to create the bar chart. After that, include the “weight” parameter that accepts the same values as the fontweight parameter, such as ‘bold’, 700 to indicate the desired text weight.
Output
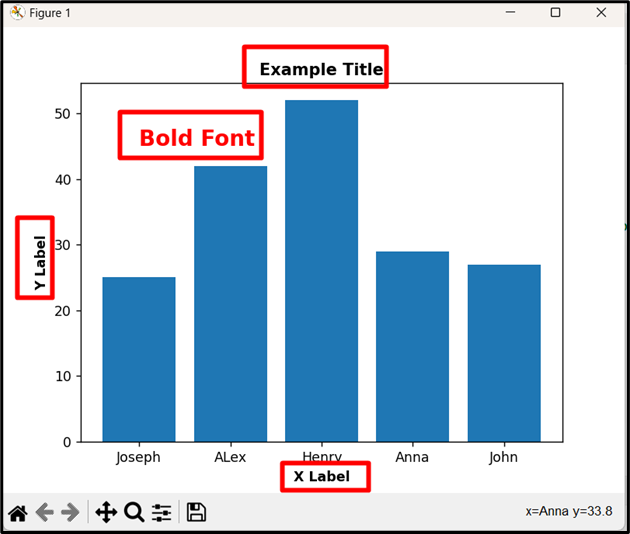
As analyzed, the title text, annotated text, xlabel, and ylabel text have become bold via the “weight” parameter.
Conclusion
The “fontweight” and “weight” parameters are used to bold a text in Matplotlib. Bolding a text emphasizes key information and enhances visualizations. The fontweight and weight parameters accept the specified string and numerical values such as ‘bold’, 700, or bold, to indicate the desired text weight. This Python post presented an in-depth guide on how to bold a text in Matplotlib using numerous examples.
Source: linuxhint.com