Linux Top Command with Examples
In Linux systems, the “top” command reports the valuable system information like running processes and resource usage. It shows the processor activity and kernel-managed tasks in real time. It’s one of the staple tools for system administrators.
In this guide, check out how to use the “top” command in Linux.
- How Does the Top Command Work in Linux?
- Display the Processes of the Particular User
- Color the Process
- Color the Respective Column
- Change the Delay Time or Add an Interval
- Kill the Task/Process
- Search the Process
- Renice a Task/Process
How Does the Top Command Work in Linux?
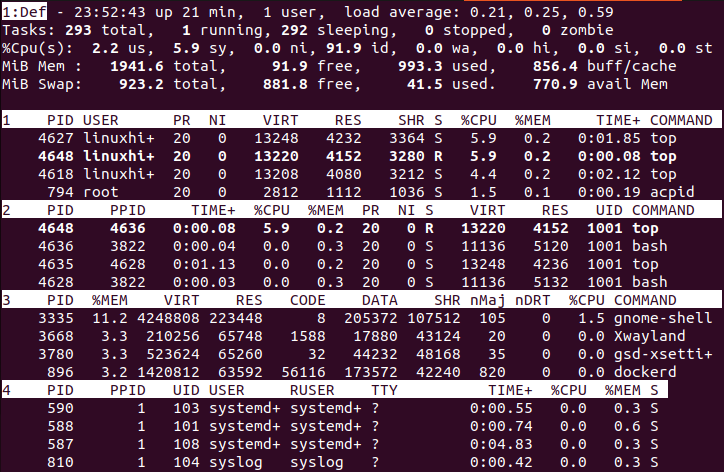
The “top” command is used to show the processes and their details. It shows the summary of information on all the running processes in the system. This interface of the top command is divided into two parts. The higher one shows the stats value, whereas the lower one shows the list of running processes.
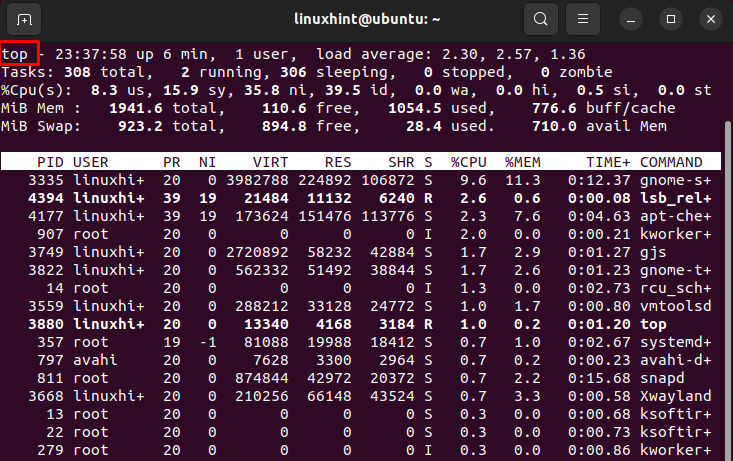
This shows the process IDs and their information. Information like tasks, CPU, and memory are also displayed. The window of the top command can be quit using the “q” key.
The first heading portion reports the hardware resource usage. The first line consists of the time, the amount of time that the system is running, the number of logged-in users, and the load average. The second line reports the number of tasks along with their states.
Here’s a quick list of all the states. The value of each state describes how much time the CPU spends in executing the processes of that state.
us: Executing processes that run under the userspace.
sy: Executing system kernel processes.
ni: Executing processes with a manually configured nice value.
id: The amount of time that the CPU remains idle.
wa: Waiting time for the I/O to complete.
hi: Servicing hardware interrupts.
si: Servicing software interrupts.
st: Time lost for running the virtual machines, also known as “steal time”.
The fourth line describes the system memory usage. For example, the total physical memory amount and how much of it is used, free, buffered, or cached.
The second part of the output is a table that lists all the running processes. Here’s a quick explanation of all the columns that constitute the table. All these explain the various attributes of the related process.
PID: The process ID of the process.
USER: The user that the process is running under.
PR: Processor priority.
NI: Processes nice value.
VIRT: Virtual memory used.
RES: Resident memory used.
SHR: Shared memory used.
S: Process status. It has five types which are as follows:
- D: Uninterruptible sleep
- R: Running
- S: Sleeping
- T: Traced
- Z: Zombie
%CPU: CPU time consumed by the process.
%MEM: Percentage of physical memory used.
TIME+: Total CPU time used (in milliseconds).
COMMAND: The command that the process is running with.
That’s a lot of information to digest. It’s alright to take time and learn them slowly.
Example 1: Display the Processes of a Particular User
If we want to know the process of a specific user, we use the following command to know the details:
Example 2: Color the Process
To identify or clarify, the running process can be highlighted or colored using a specific keyword, “z”. This supports in identifying the running process very easily. You need to use the command while the process is running. Because once you quit the process detail and then apply the color, that never works. It only works in the existence of the running processes of the user. Press “z”:
If you want to remove the color or go back to the previous situation, press the same key.
Example 3: Color the Respective Column
To highlight the specific column from the result, you need to use the “b” key to run the top command prompt:
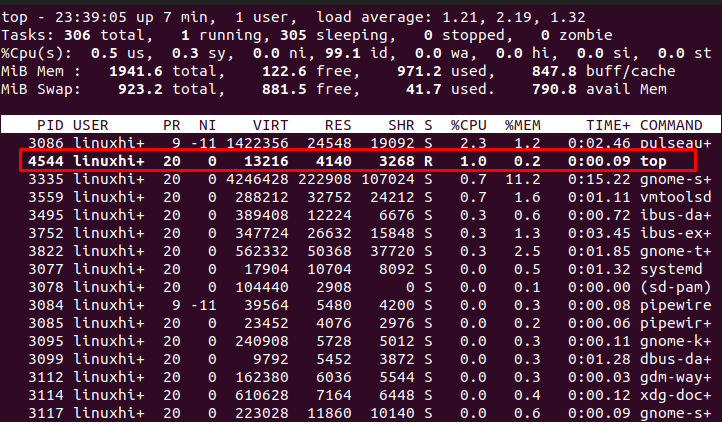
Example 4: Change the Delay Time or Add an Interval
Many processes of the same or different users are running at a time. To speed up the system process or to do it more accurately, we need to add the time intervals between the processes. In Linux, this could be done by pressing the “d” option which changes the delay time. By default, it is 3, but we can change it by providing a new number. It is also known to be a screen refresh interval. Press “d” and change the delay from 3.0 to 4.0:
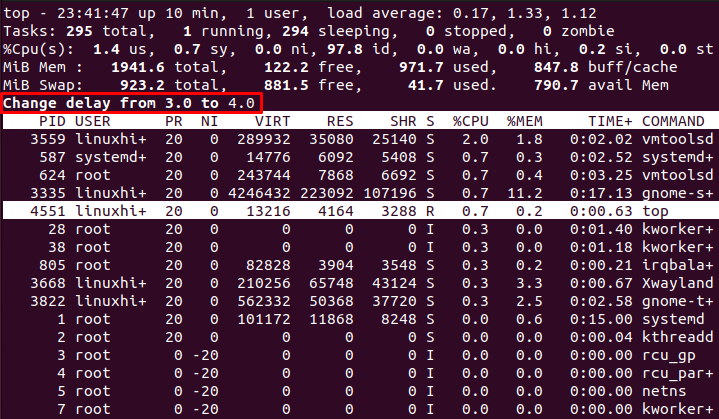
The output shows that the delay option is changed from 3 to 4. The “d” option deals with specifying the delay between the screen updates. This time is again changed back using “d” or the “s” key again. The negative number is not allowed to enter for the delay time.
Example 5: Kill the Task/Process
You can kill the task by finding the PID that you want to cease working. To abort the process, you may have to do two things: one is to either press the enter tab at the PID prompt or the other is to type O at the signal prompt. This can be done by pressing the “k” option in the top running command. Make sure that you have not exited from that window. Otherwise, it will not work.
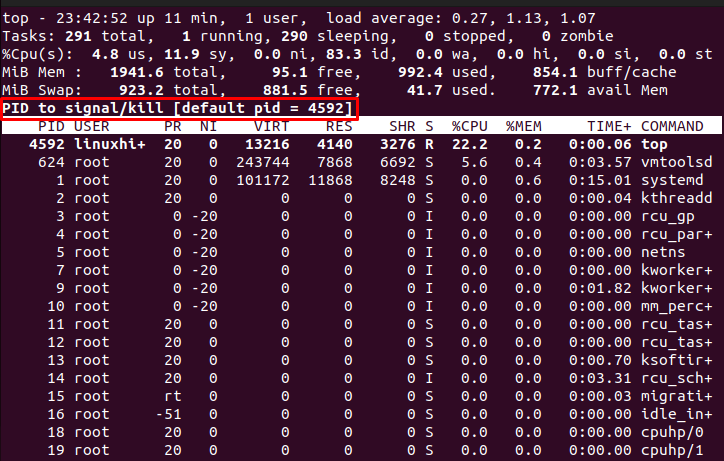
After pressing the key, the screen shows the line that wants a PID from you so that the system identifies this ID and aborts it. The output shows that we provided the recent ID to be ceased.
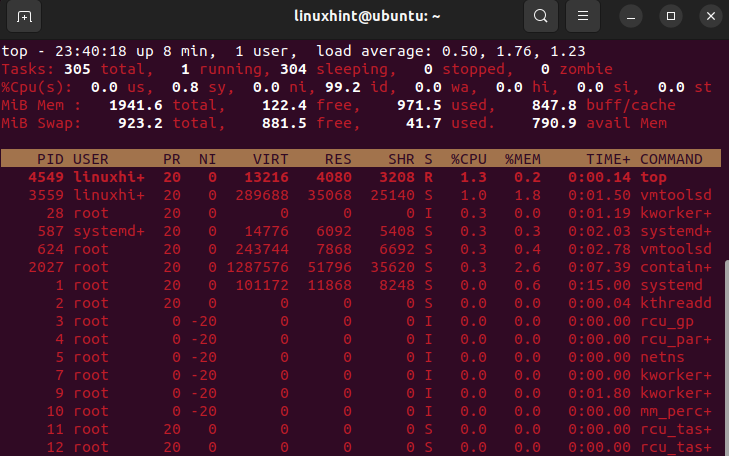
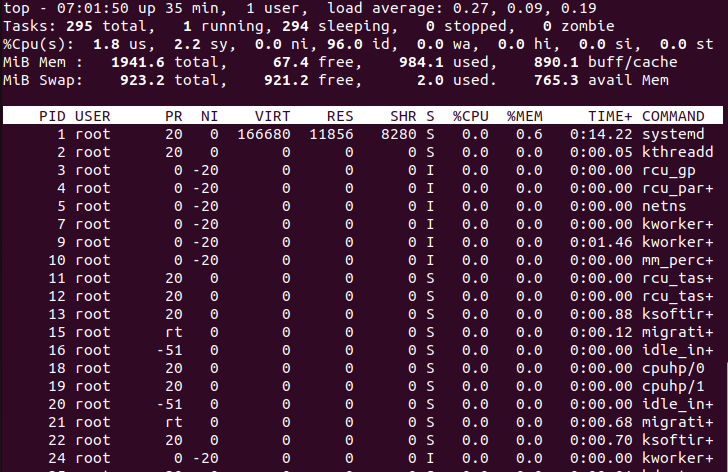
Example 6: Search the Process
You can filter the process list according to your own choice by providing the criteria like memory usage, CPU process name, etc. For this purpose, you need to press “o” in the running top command prompt.
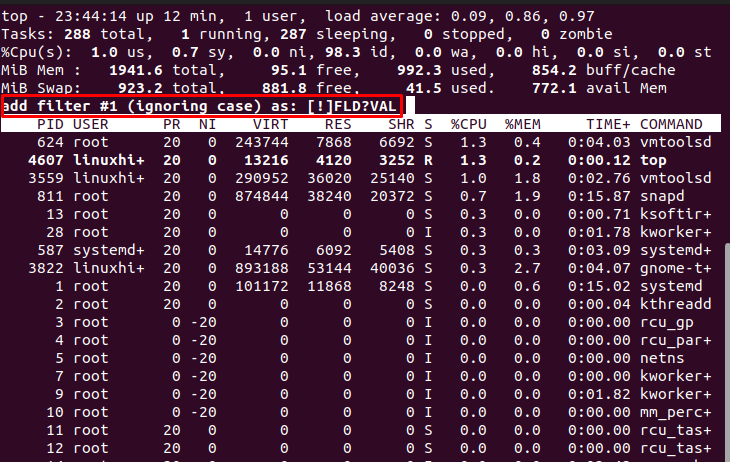
When you press the “o” key, a line is shown. This shows the format of the filter.
The field that you want to search for can be written after the line has ended. Suppose we want to filter the result with the help of a command name, we write it like this – “COMMAND = rcu_ta+”.
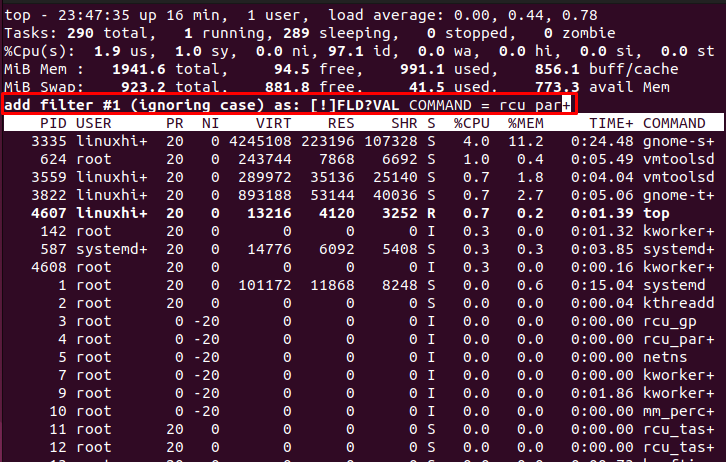
After that, hit the enter tab. After this, you will see that only the lines that have the commands equal to your searched criteria are shown in the result.
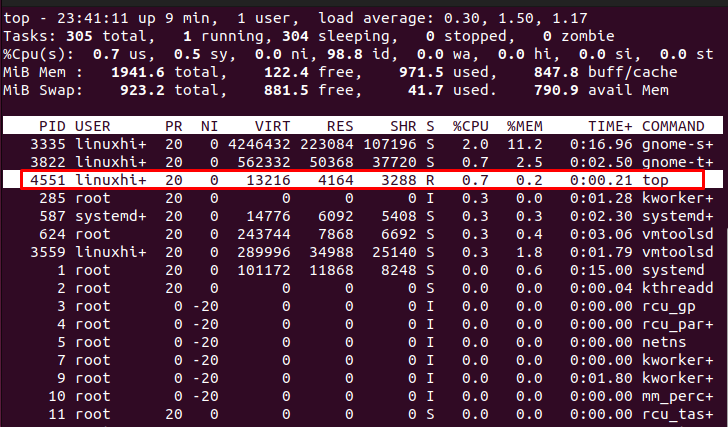
Example 7: Renice a Task/Process
If you want to change the priority of any process or task, use the “r” option. After entering the key to the prompt, a line is shown where you need to enter the PID to change the priority.
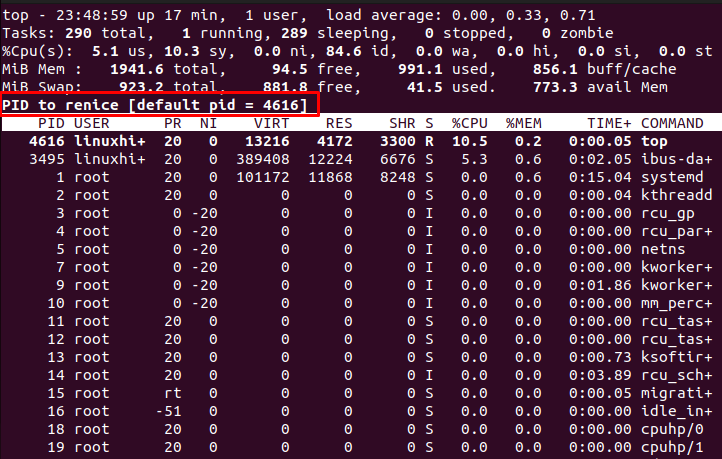
If you write a positive number, it causes the current process to lose priority. Whereas the negative number causes the kernel to give it more importance.
Bonus Tip:
To show /hide the process information, some keys are as follows:
Using l: This hides the average load information from the screen that is present at the top of the description. You can see the output from the image.
Using m: This key hides the memory information from the description.
Using t: This hides the information of the CPU and tasks which are present in the system.
Using f: You can manage the columns by hiding and showing them by your choice. It is done by pressing f in the top command prompt.
Operating Batch Mode
To observe the batch mode, you need to exit the top command prompt and then write the command. This is used to send an output to the other processes or files.

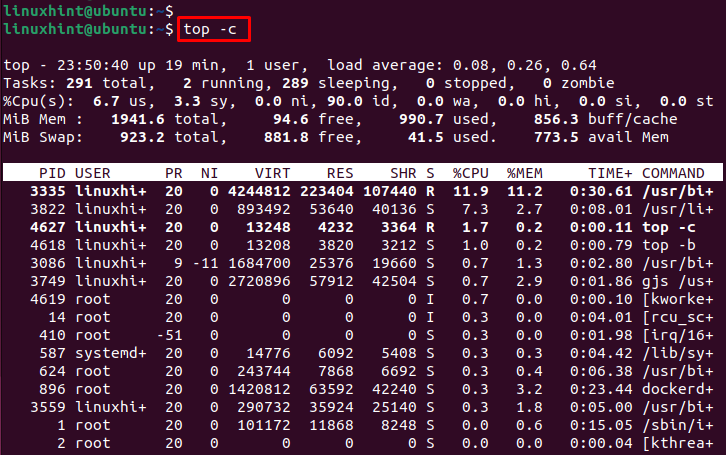
Top Command Line
If you want to see the last state/position of the processes when you close it the last time, we can use the “c” option in the command. The last state is reserved. When you open the top command prompt the second time, it starts from the same state.
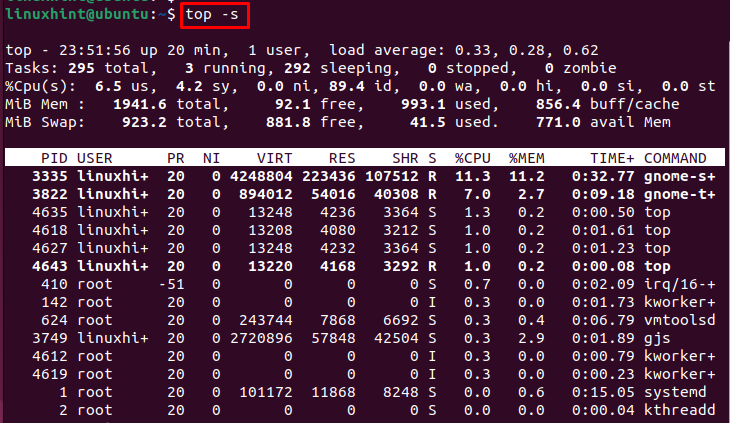
Top Mode Security
If you want to secure your top command resultant value mode, you can do this using the “s” key in the top command:
Idle processes are toggled by a specific key. We use “I” to toggle the idle or sleepy processes.
Sort Reversely
To arrange the output in reverse order or to display it in ascending order, you need to use the “R” key in the command.
Display the Output in Different Panels
If you want to split the output view, you may use the “A” key in the top command prompt. Each panel contains different files and different sets in the display.
Conclusion
This article is collectively done by adding the simplest to critical examples of the Linux Top commands. These commands show the daily usage in the Linux operating system such as displaying the processes of the particular user, coloring the process, coloring the respective column, changing the delay time, killing the task/process, and searching the process. The top is a complicated yet powerful tool to monitor your system.
Source: linuxhint.com