How to Use the Matplotlib imshow() Method
Like other programming languages, images are processed by utilizing the number in Python, and multiple functions/methods are used for this specified purpose. In Python, the “imshow()” method of the matplotlib package is utilized for displaying the graphics. The matplotlib is most commonly used for visual analytics and graphics including data.
This guide will describe the usage of the matplotlib “imshow()” method.
How to Use the Matplotlib “imshow()” Method?
For using the matplotlib “imshow()” method, users need to first import the “matplotlib.pyplot” and “numpy” libraries:
import numpy as np
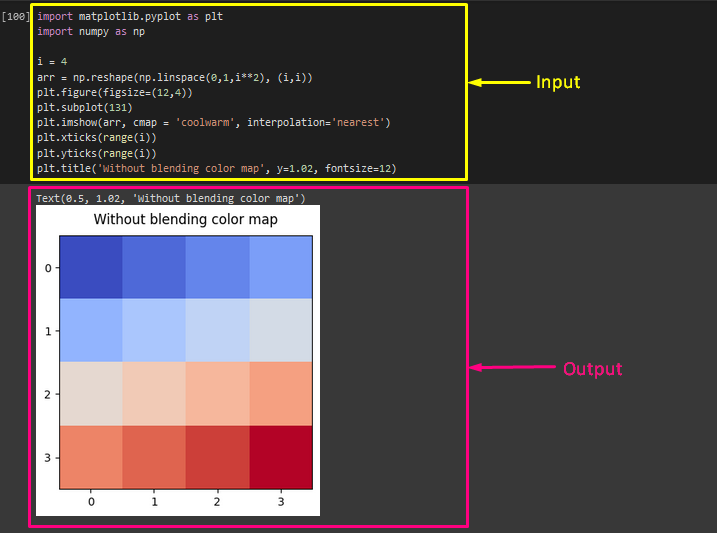
Then, initialize the “i” variable and set the desired number of square blocks in this defined variable. Then, use the “np.linspace()” function inside the “reshape()” method to create an “nxn” numpy array and store it in the variable. After that, apply the “figsize()” function to specify the size of the plot:
arr = np.reshape(np.linspace(0,1,i**2), (i,i))
plt.figure(figsize=(12,4))
Now, use the “plt.subplot()” built-in method and “plt.imshow()” function and pass the parameters as numpy array “arr” for generating the image. Then, specify the desired color using the color map “cmap” as “coolwarm”. After that, the “interpolation” parameters blend the square colors of blocks, but the “nearest” value will not blend the block color:
plt.imshow(arr, cmap = 'coolwarm', interpolation='nearest')
Next, use the “plt.tricks()” method to the x-axis and y-axis to set the range of the tick’s number on both axis positions. Then, apply the “plt.title()” function to add the graph label with its font size:
plt.yticks(range(i))
plt.title('Without blending color map', y=1.02, fontsize=12)
That’s all! We have explained the usage of the matplotlib “imshow()” method.
Conclusion
The matplotlib “imshow()” method can be used for creating an image from a 2-D numpy array. The generated image will contain one square for each element of the array and each square color is determined by the value of the provided array items by using the “imshow()” method. This guide illustrated the usage of the matplotlib “imshow()” method in Python.
Source: linuxhint.com