How to Specify Plot Colors in MATLAB – Quick Guide
MATLAB is a useful tool for solving various computational problems. It offers a wide range of functionalities, such as data visualization, and facilitates the ability to create various plots. These plots are created using the default set of colors, which might not always align with the specific requirements or preferences of users.
This article is going to discuss how to specify plot colors in MATLAB using some examples, allowing you to customize your plot according to your needs.
How to Specify Plot Colors in MATLAB?
MATLAB generates plots using a standard color scheme; however, we can change the colors as required. Many visualization tools allow us to specify the color using an input argument, such as colorspec or c. These tools often return objects with color-controlling characteristics. The properties and arguments may have different names, but the values they allow normally follow a pattern. Once we understand the pattern, we can apply it to many visualizations.
How Many Types of Color Values in MATLAB?
In general, we have three types of color values in MATLAB as given below:
- Color Name or Short Name: Users can specify colors using their common names, such for red, you can use r while for green, you have to use g, and so on.
- RGB Triplet: A row vector having three elements with red, green, and blue color intensities, components as constituents can be used to create customized colors. The intensities must fall within the [0, 1] range. Here 0 represents no intensity, while 1 represents full intensity. For example [1,0,0] represents pure red color.
- Hexadecimal Color Code: MATLAB also allows its users to create custom colors using hexadecimal color codes. A hexadecimal code is a string or character vector that begins with the hash symbol (#) and contains three to six hexadecimal numbers that can be in the range of 0 to F. For example, #FF0000 represents the pure red color.
Examples
Let’s consider some examples to understand how to specify plot colors in MATLAB.
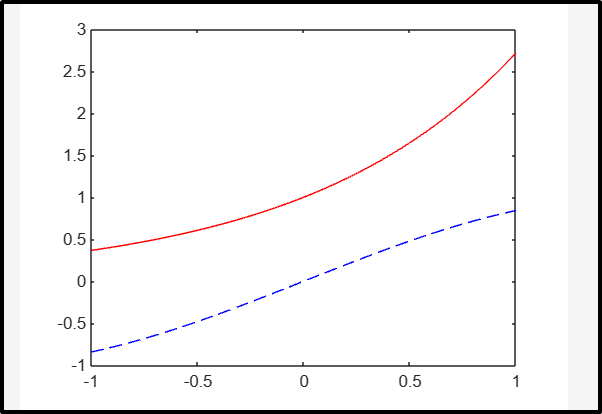
Example 1: How to Specify Plot Colors in 2D Line Plots?
In this example, we create two 2D line plots in one figure window by specifying the red color for the first plot and the black color for the second plot.
Y1 = exp(X);
Y2 = sin (X);
figure
plot(X, Y1, ‘r’, X, Y2, ‘–b’)
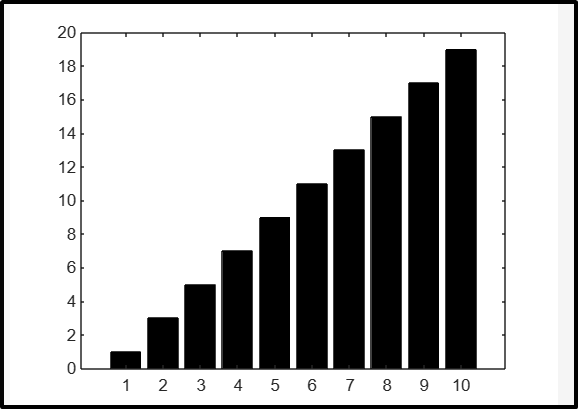
Example 2: How to Specify Plot Colors in Bar Graph?
This example creates a bar graph by specifying the black color.
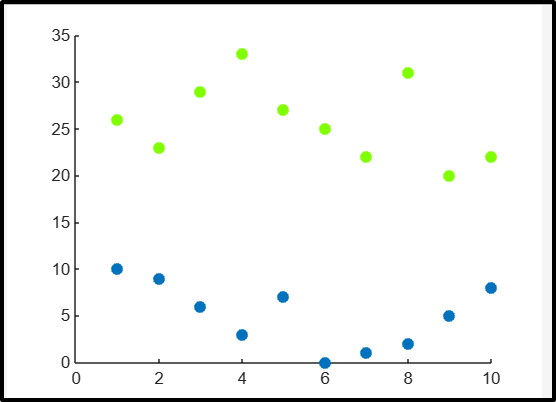
Example 3: How to Specify Plot Colors in Scattered Plots?
Using this MATLAB code, we create 2 scattered plots first and then change the color of the s2 plot using RGB triples.
x = 1:10;
s1 = scatter(x,[10 9 6 3 7 0 1 2 5 8],50,‘filled’);
hold on
s2 = scatter(x,[26 23 29 33 27 25 22 31 20 22],50,"filled");
hold off
s2.MarkerFaceColor = [0.5 1 0]
Conclusion
MATLAB is a beneficial tool used for plotting 2D or 3D data. These plots use default colors but we can change these colors by specifying any color value. These color values include color name or short name, RGB triples, and hexadecimal color code. This tutorial has presented an easy guide to specifying plot colors in MATLAB using some examples.
Source: linuxhint.com