How to Specify Line and Marker Appearance in Plots in MATLAB?
MATLAB creates a plot using the default set of line and marker styles however if we want to specify the other marker and line styles, we can perform it in various ways such as using Line Spec as an optional argument in the different functions of plot creation or by using the plot object.
Follow this guide to learn how to specify line and marker appearances in the plot in MATLAB.
How to Specify Marker and Line Appearances in the Plots in MATLAB?
To specify marker and line styles in the plot in MATLAB, first, we need to create a line plot using MATLAB’s built-in plot() function having the optional input argument LineSpec. For this, follow the given below steps:
Step 1: Draw a line plot using MATLAB’s plot() function.
Step 2: Include the optional input LineSpec argument.
Step 3: Specify the marker and line styles of your choice. We can also specify the marker size and color if required.
Line Styles
By default, a line plot creates a solid line while plotting a function; however, we can customize the line style by using any of the given line styles.
| Line Style | Description |
| — | Dashed line |
| -. | Dashed-dotted line |
| – | Solid line |
| : | Dotted line |
Marker Styles
Markers are used with line styles to specify the (x, y) point in the given plot. There are various marker styles to represent the (x, y) point in the XY plane that are given below:
| Marker Style | Description |
| + | Plus sign |
| – | Horizontal line |
| * | Asterisk |
| ^ | Upward pointing triangle |
| . | Point |
| < | Left pointing triangle |
| > | Right pointing triangle |
| | | Vertical line |
| o | Circle |
| v | Downward pointing triangle |
| square | Square |
| diamond | Diamond |
| hexagram | Hexagram |
| pentagram | Pentagram |
Examples
Consider some examples to understand how to specify line and marker styles in the plot in MATLAB.
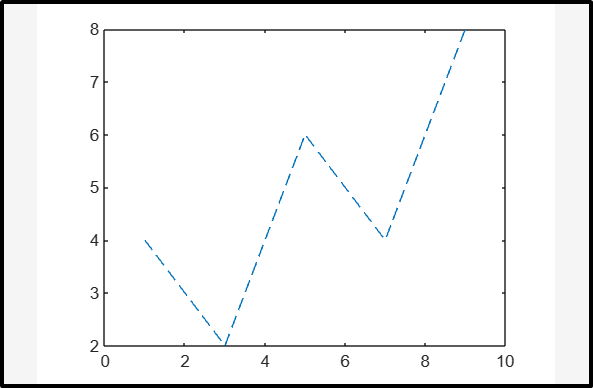
Example 1: Create a Line Plot by Specifying the Line Style “–”
In the given example, we create a line plot using the plot() function by specifying the line style “–”.
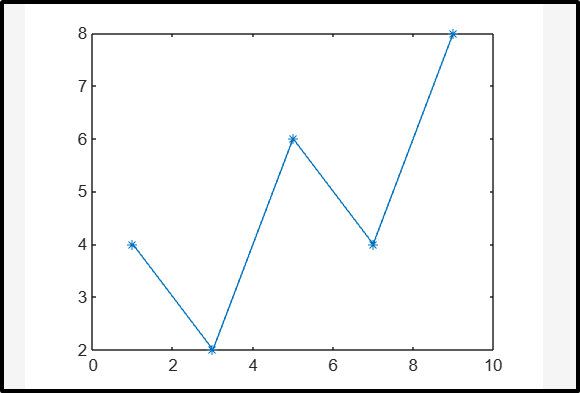
Example 2: Create a Line Plot by Specifying the Line Style “-” and Marker Style “*”
This MATLAB creates a line plot using the plot() function by specifying the line style “-” and marker style “*”.
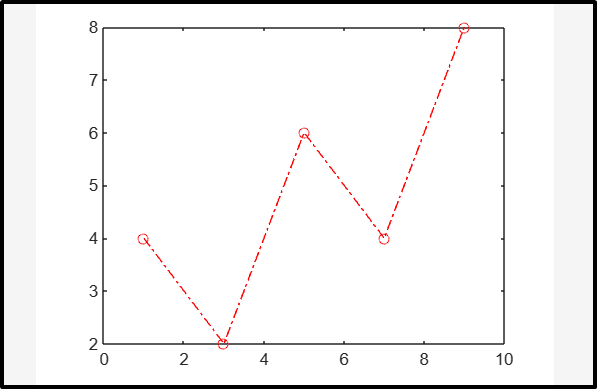
Example 3: Create a Line Plot by Specifying the Line Style “-.”, Marker Style “o” and Color as “r”
The given example creates a line plot using the plot() function by specifying the line style “-.”, the marker style “o”, and the red color “r”.
Conclusion
MATLAB produces line plots using the default set of line and marker styles; however, we can customize the line and marker styles by using the optional input LineSpec argument. MATLAB includes multiple marker and line styles. Using some examples, this guide proved to be crucial in helping MATLAB beginners learn the art of specifying marker and line appearances in their plots.
Source: linuxhint.com